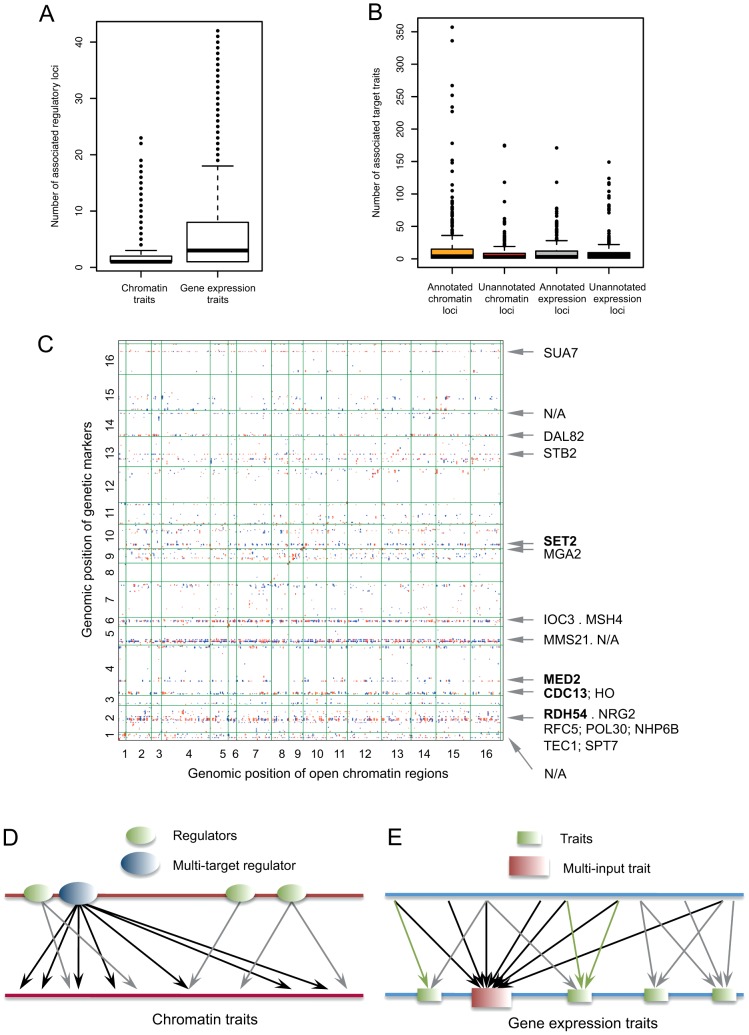
Figure 3. Characterization of trans-associations.
(A) The number of trans-regulatory loci associated with each chromatin trait (left) and gene expression trait (right). (B) The number of target traits of each trans-regulatory locus was examined for chromatin QTLs and expression QTLs. Annotated QTLs were defined as having at least one known regulator in the vicinity. (C) In this chromatin association map, each dot indicates a linkage between a genetic marker (QTL; y axis) and a trait (OCR; x axis); red or blue indicates that the BY or RM genotype positively regulates the OCR, respectively. The annotation of the 17 QTL hotspots is shown on the right side. The names of the regulators associated with the same genetic marker are separated by a semicolon and those associated with closely located markers by a dot. N/A denotes an unannotated QTL. (D–E) Different regulation architectures of chromatin traits (D) and gene expression traits (E). On the regulator side, most chromatin regulatory loci are responsible for a few traits; however, certain regulatory loci can have upwards of 100 targets. On the target side, individual chromatin traits are usually targeted by less than five loci. The average number of associated loci is three times higher for gene expression traits than for chromatin traits, an indication that the transcription process is responsive to more regulatory inputs or stimuli.

