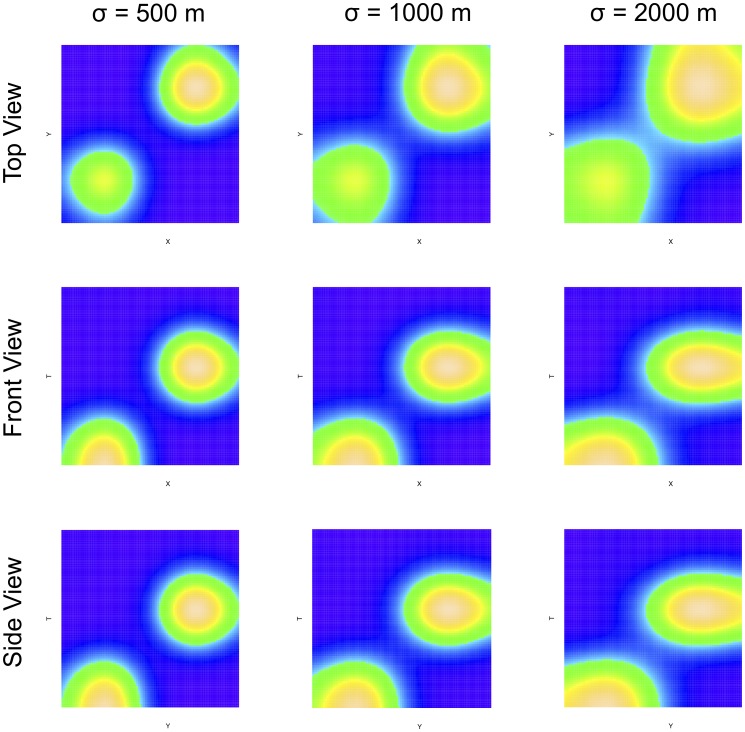
Figure 1. Intensity of the three simulated event patterns.
Each panel shows a different perspective of a space-time cube for the three patterns. The left most column corresponds to the high intensity cluster pattern (where cluster events are concentrated in a smaller area) and the right-most column corresponds to the lowest intensity pattern. The top row shows an areal view of the space time cubes (i.e. a conventional map), the middle row shows a front view of the cubes, while the bottom row shows a side view. Lighter areas indicate a higher intensity of events.

