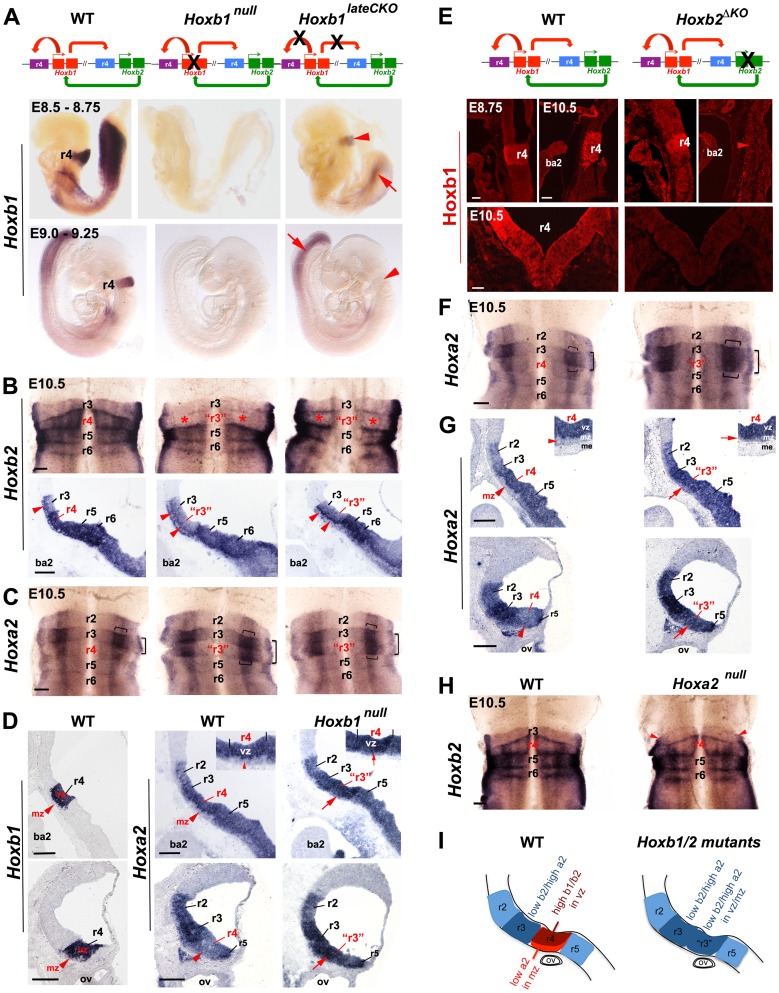
Figure 2. Regulatory interactions between Hoxb1, Hoxb2, and Hoxa2 in r4.
(A) The diagrams above the panels indicate the interactions between Hoxb1 and Hoxb2. While Hoxb1 auto-regulates its own expression in r4, it also binds to an Hoxb2 r4 enhancer to maintain Hoxb2 expression in r4. Hoxb2 maintains expression of Hoxb1 in r4. Crosses indicate loss of Hoxb1 protein in Hoxb1null embryos and loss of the auto- and cross-regulatory loops in Hoxb1lateCKO mutants. Lateral views of E8.5 to E9.25 embryos indicate that while Hoxb1 expression is still maintained in r4 (although at lower levels) of E8.75 Hoxb1lateCKO mutants, r4 expression is completely abolished in E9.25 mutant embryos (arrowheads). Expression in the posterior region is still maintained at both ages (arrows). (B) Ventricular views of flat-mount preparations of E10.5 WT, Hoxb1null and Hoxb1lateCKO hindbrains hybridized with Hoxb2. Expression of Hoxb2 is strongly decreased (but not abolished) in r4 of Hoxb1null and Hoxb1lateCKO embryos, at similar levels to r3 (asterisks). R4 acquires an expression pattern of r3, as indicated by “r3”. Down-regulation of Hoxb2 in r4 can also be appreciated in mid-sagittal sections of mutant embryos. The line of cells expressing high levels of Hoxb2 denotes early post-mitotic cells (arrowhead). (C) Ventricular views of flat-mount preparations of E10.5 WT, Hoxb1null and Hoxb1lateCKO hindbrains hybridized with Hoxa2. Expression of Hoxa2 is increased in r4 and the characteristic Hoxa2 expression profile of r3 is now duplicated in r4 of Hoxb1null and Hoxb1lateCKO embryos supporting an r4 to r3 change of identity. The horizontal and vertical brackets indicate higher expression domains of Hoxa2, respectively in a large intermediate stripe and in a thinner lateral stripe of the sensory column, the presumptive auditory column. (D) On the left, expression of Hoxb1 indicates the position of r4 on sagittal sections. On the right, increased expression of Hoxa2 is detected in the ventricular and mantle layers of r4 at two different dorsal levels in Hoxb1null embryos. In mutant embryos, the expression of Hoxa2 is maintained at levels comparable to r3 in the r4 mantle zone (mz) (i.e. post mitotic neurons) with respect to WT (arrows, see also insets). (E) In Hoxb2ΔKO mutants, lack of Hoxb2 (indicated with a cross) results in failure to maintain Hoxb1 expression in r4. Sagittal and coronal views show that Hoxb1 protein is present in r4 of E8.75 embryos, but not maintained in E10.5 Hoxb2ΔKO mutant embryos. (F) Flat-mounted hindbrain preparations hybridized with Hoxa2 show a duplication of r3 features in r4 in E10.5 Hoxb2ΔKO mutant embryos. Hoxa2 expression levels are increased in r4 in the absence of Hoxb2, similarly to Hoxb1 mutant embryos. (G) E10.5 sagittal sections in dorsal regions indicate increased expression of Hoxa2 in ventricular (vz) and mantle (mz) zones of r4 (arrows, see also insets) mimicking the expression profile of r3. (H) Flat-mounted hindbrain preparations of E10.5 WT and Hoxa2null embryos hybridized with Hoxb2. No particular expression changes can be observed in mutant embryos. Red arrowheads indicate a defect in alar r2/r3, as previously described [66]. (I) Schematics summarizing the expression of Hox genes in r4 of Hoxb1 or Hoxb2 mutants. Scale bars, 200 µm (B, C, F and H); 100 µm (E top); 50 µm (E bottom). ba2, second branchial arc; me, mesoderm. See also Figures S3, S4 and S5.

