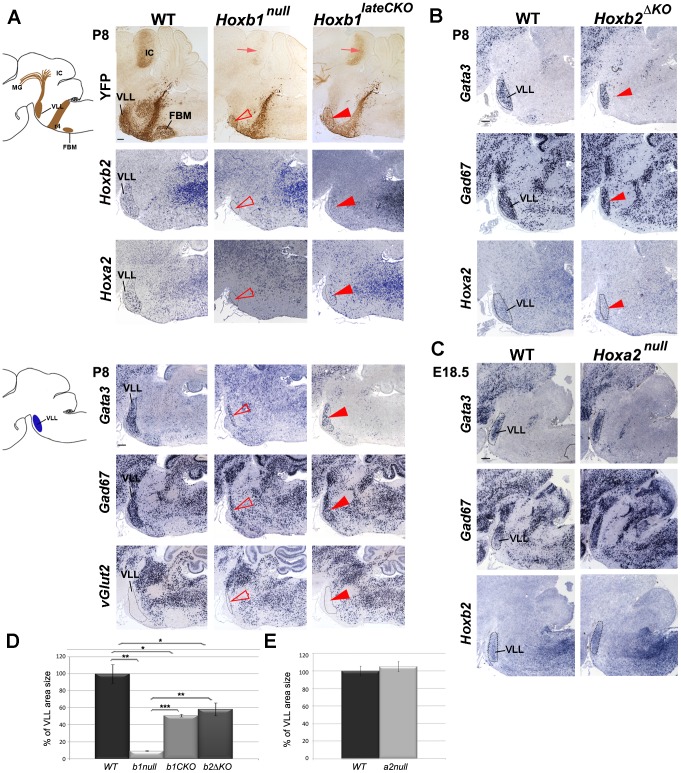
Figure 3. The r4-derived VLL is affected in Hoxb1 and Hoxb2 mutant mice.
(A) Schematic view of a sagittal brain section indicating the YFP+ r4-derived nuclei and projections. A strong reduction of the YFP+ VLL nucleus (arrowhead) and projections (arrow) in Hoxb1 mutants is observed. In constitutive mutants the reduction is much more severe than in conditional mutants, as quantified in (D). Adjacent sagittal sections show no Hoxb2 and Hoxa2-expressing cells in Hoxb1null mutants, whereas cells in the reduced VLL of Hoxb1lateCKO still express Hoxb2 and Hoxa2. Adjacent sections of another P8 pup confirm reduction of the VLL and indicate persistence of Gata3- and Gad67-expressing cells in both Hoxb1 mutants. No ectopic expression of VGlut2 is detected in the VLL region. (B) The VLL is reduced in Hoxb2ΔKO mutant pups, similarly to Hoxb1lateCKO mutants, as indicated by expression of Gata3, Gad67, Hoxa2 and quantification in (D). (C) In contrast, Hoxa2null mutants show no significant changes in the VLL position and size quantified in (E). The apparently bigger shape is due to the slightly oblique sections in mutant compared to WT brains. (D) Histogram showing the percentage of the VLL area size in WT (set up to 100%) and in the different genotypes as indicated on the y-axis. Mutants show statistically significant differences when compared to WT, or when Hoxb1lateCKO and Hoxb2ΔKO are compared to Hoxb1null (inter-genotype comparison, ANOVA p<0.001; Hoxb1null versus WT: p = 0.001; Hoxb1lateCKO versus WT: p = 0.01; Hoxb2ΔKO versus WT: p = 0.04; Hoxb1lateCKO versus Hoxb1null: p<0.001; Hoxb2ΔKO versus Hoxb1null: p = 0.003). However, no statistically significant difference is found between Hoxb1lateCKO versus Hoxb2ΔKO (p = 0.39). (E) Histogram showing the percentage of the VLL area size in WT and Hoxa2null. No statistically significant difference is found (WT versus Hoxa2null: p = 0.56). FBM, facial branchiomotor nucleus; VLL, nucleus of lateral lemniscus; IC, inferior colliculus; MG, medial geniculate nucleus. Scale bars, 200 µm. See also Figure S6.

