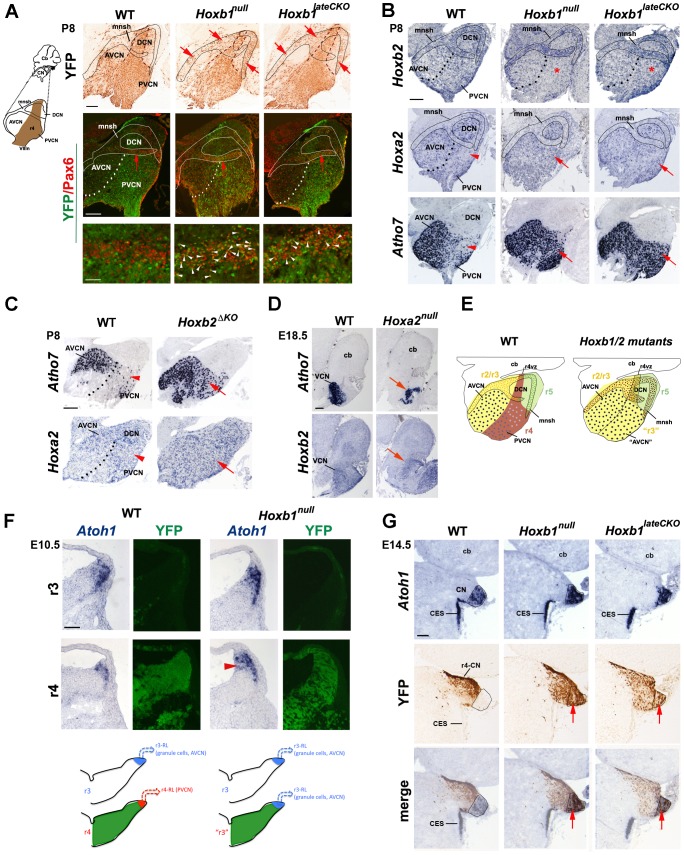
Figure 4. The cochlear nuclear complex is differently affected in Hoxb1, Hoxb2, and Hoxa2 mutants.
(A) Ectopic YFP+ r4-derived cells (arrows) are observed in the cochlear microneuronal shell (mnsh) (limited by solid line) of P8 Hoxb1null and Hoxb1lateCKO mutant sagittal sections. These cells now express Pax6 indicating that they are granule cells (white arrowheads). (B) Hoxb2 expression is decreased in the PVCN of Hoxb1null and in Hoxb1lateCKO mutants (asterisks). On the contrary, Hoxa2 expression is increased and Atoh7, normally expressed at high levels only in the AVCN, is dramatically up-regulated in the PVCN of P8 Hoxb1 (B) and Hoxb2ΔKO mutant pups (C) (arrows). Arrowheads in WT indicate Hoxa2 and Atoh7 low-expressing regions. (D) Formation of the AVCN is strongly affected in E18.5 Hoxa2null brains, as seen by decreased expression of Atoh7 and Hoxb2 (arrows). (E) Summary schematic indicating that in the absence of Hoxb1 and Hoxb2, the PVCN (r4-derived in brown) has acquired AVCN-like features (r2/3-derived in yellow) and YFP+ cell (brown) contribute to the shell. (F) The dorsal-most regions of WT and Hoxb1null hindbrains at r3 and r4 levels on adjacent coronal sections hybridized with Atoh1 and revealed by YFP epifluorescence (indicates r4 levels). Atoh1 is expressed in progenitors and differentiating cells migrating along the lateral ridge. The Atoh1-expressing domain is reduced in r4 compared to r3 in WT, whereas an enlarged Atoh1-expressing domain (arrowhead) is identified in r4 of Hoxb1null embryos. (G) On adjacent coronal sections at E14.5, YFP+ (r4-derived) cells located more laterally, do not overlap with Atoh1 + cells in the presumptive cochlear nucleus (CN), which originates from the r2–r5 auditory lip. In the absence of Hoxb1, YFP+ cells invade the Atoh1 + domain, thus acquiring the Atoh1 fate of adjacent rhombomeres. Cb, cerebellum; CES, caudal extramigratory stream. Scale bars, 200 µm (A up panels, B, C, D), 50 µm (A bottom panels), 100 µm (F, G). See also Figure S2.

