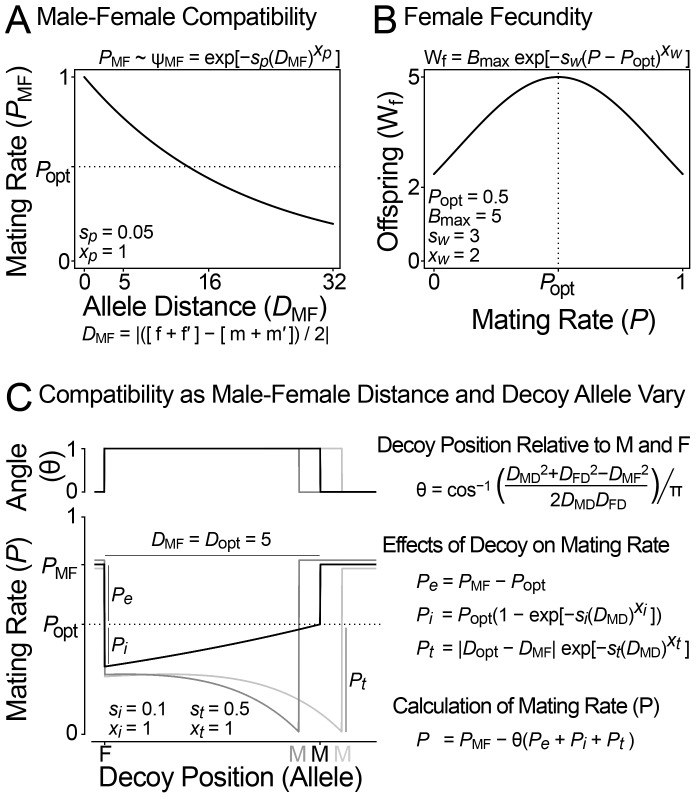
Figure 4. Model of sexual conflict with a female decoy.
(A and B) Hayashi et al's original diploid model of sexual conflict [56]. (A) The mating rate (P) depends on the phenotypic distance between male and female reproductive loci (DMF), which is determined additively from the allelic values of the male and female loci (f|f′ and m|m′). (B) The number of offspring per female (Wf) decreases from her maximum (Bmax) as her mating rate deviates from the optimal female mating rate (P opt). The scale (sw) and exponent (xw) parameters describe the shape of this relationship. Males maximize their reproductive output at P = 1, females at P = Popt, and thus they are in conflict over optimal mating rate. (C) A model describing the influence of a female decoy on mating rate. A female-expressed decoy locus modifies the mating rate of a male-female pair (PMF) by Pe, Pi and Pt. The decoy only influences mating rate when its additively determined phenotypic value is between those of the male and female (θ). The decoy's influence on mating rate depends in part on the male-decoy distance. Pe (decoy effectiveness) reduces mating rate to the female's optimal value. Pi (decoy interference) further reduces mating rate when the decoy and female are similar. Pt (the magnitude of female-decoy interference) depends on an optimal male-female distance for decoy function (D MF = D opt). The black line shows the effect of the decoy when DMF = Dopt: as the distance between decoy and male decreases, the decoy causes mating rate to approach the female optima Popt. Grey lines show how the decoy reduces mating rate (Pt) when the male and female loci are not separated by the optimal distance for decoy function: D MF = D opt±0.5. The scale (si, sd) and exponent (xi, xd) parameters control the shape of the Pi and Pt curves as the position of the decoy varies.

