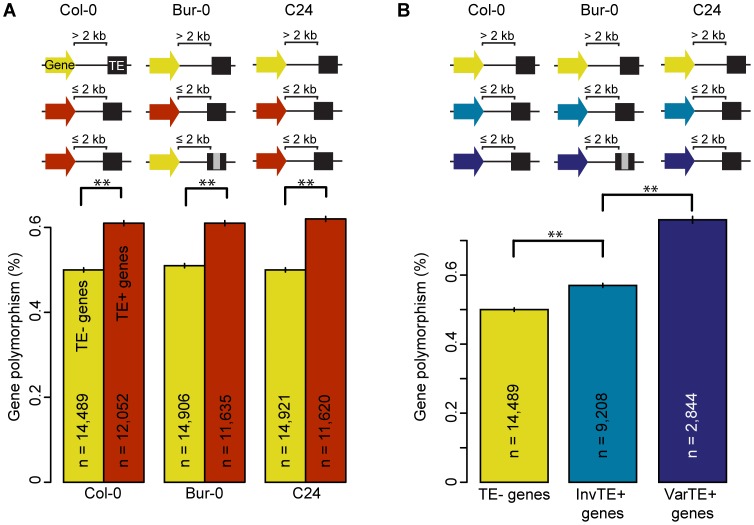
Figure 2. TE presence, variation, and the polymorphism level of proximal genes.
(a) Gene polymorphism levels in Bur-0 and C24 for TE− genes (yellow) vs TE+ genes (red). MWU p<2×10⁻¹⁶ for Col-0, Bur-0 and C24. Grey regions in the schema represent variations such as deletions. (b) Gene polymorphism levels for TE− genes (yellow), InvTE+ genes (cyan) or VarTE+ genes (navy). MWU p(InvTE+/VarTE+) = 0.005. ** = p<0.01. Standard errors are shown.

