
Figure 3. Alpha cells are only minimally restored in the Nkx2.2null;Neurod1Δendo.
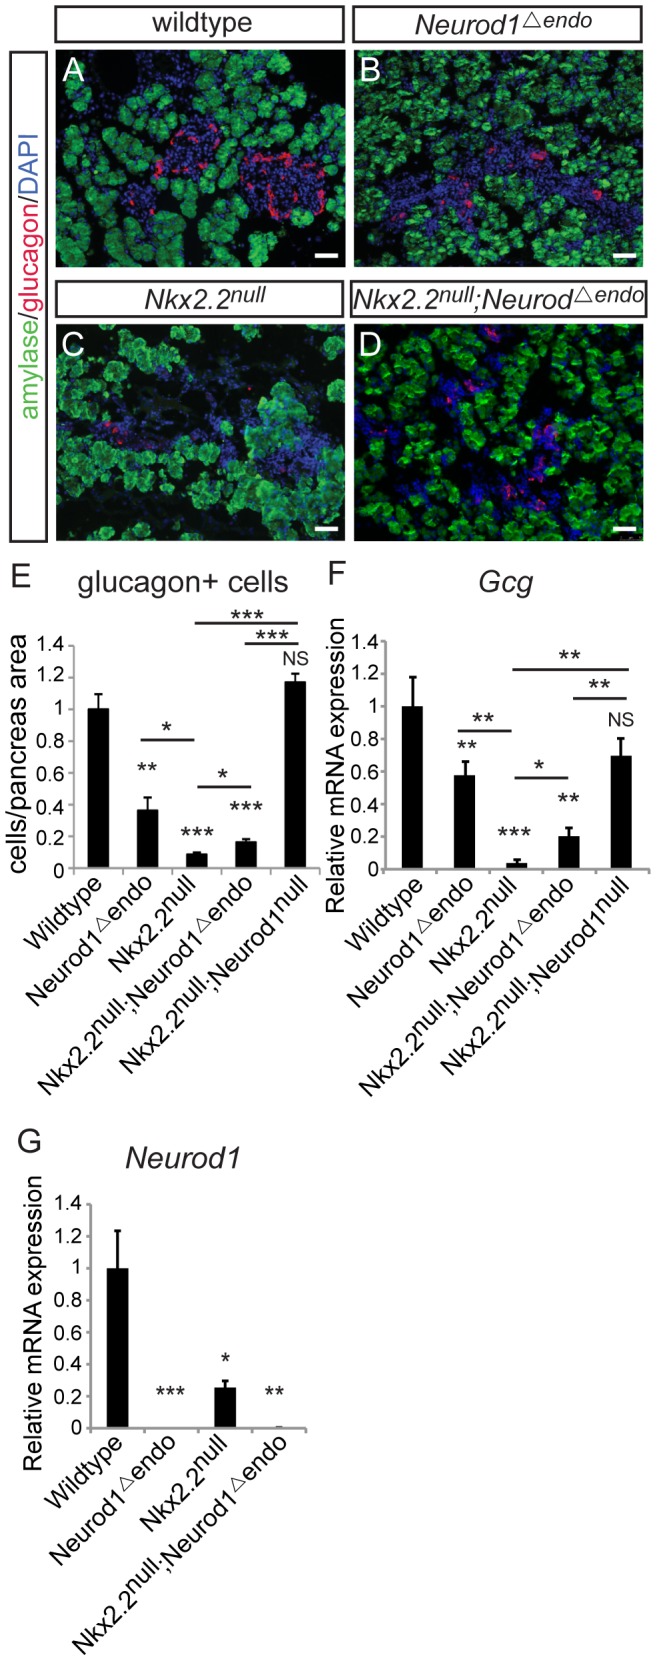
Pancreatic tissue was analyzed by immunofluorescence for the presence of glucagon-expressing cells at P0, comparing wildtype (A), Neurod1Δendo (B), Nkx2.2null (C), and Nkx2.2null;Neurod1Δendo (D). Amylase expression marks exocrine tissue in all genotypes (A–D; white bar indicates 50 microns; DAPI marks all nuclei). Glucagon-expressing alpha cells were quantified by morphometric analysis, relative to total pancreas area and displayed normalized to wildtype (E). The expression of glucagon (Gcg) (F) and Neurod1 (G) was measured by real time PCR using RNA from P0 pancreas for all genotypes (N = 3–7). Relative mRNA expression was normalized to the housekeeping gene, cyclophilinB. Data are represented as mean+/−SEM. * p<0.05; ** p<0.01; *** p<0.001.