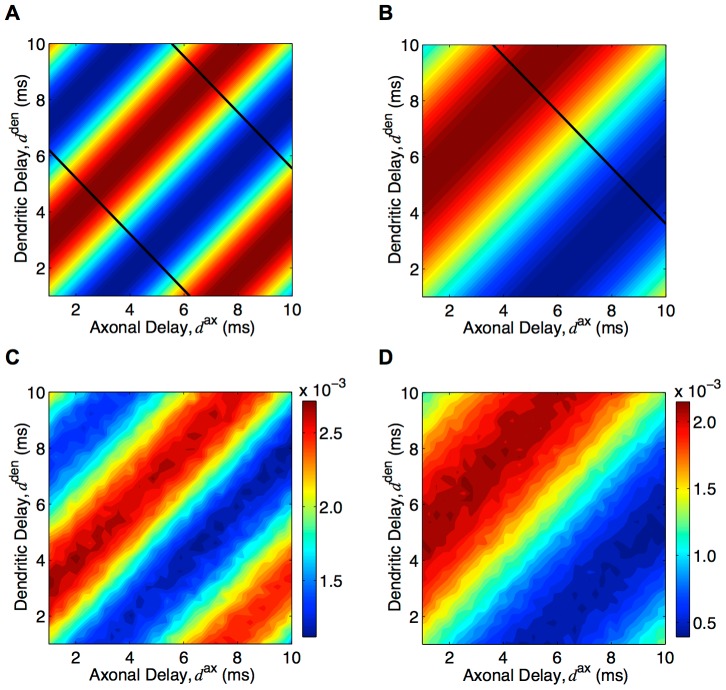
Figure 7. Axonal and dendritic delay selection.
(A) Analytically determined heat map of potentiation/depression of connections with different axonal and dendritic delay with 120 Hz inputs and ‘medium’ EPSP, as given by Equation (44). Regions of red correspond to potentiation and regions of blue correspond to depression. Black lines correspond to the delays that maximize the response at 120 Hz. (B): Same as A but with 60 Hz inputs and ‘slow’ EPSPs (black lines correspond to the delays that maximize the response at 60 Hz). (C) Resulting heat map of mean connection strengths for different axonal and dendritic delays after simulating 500s of learning with 10,000 LIF neurons, ‘medium’ EPSPs, and 120 Hz inputs. (D) Same as C but with ‘slow’ EPSPs, 60 Hz inputs, and learning for only 50s. Note that no color bars are shown in A and B as the value of the weights is arbitrary; the mean depended on the homeostatic equilibrium and the amplitude on the learning duration.

