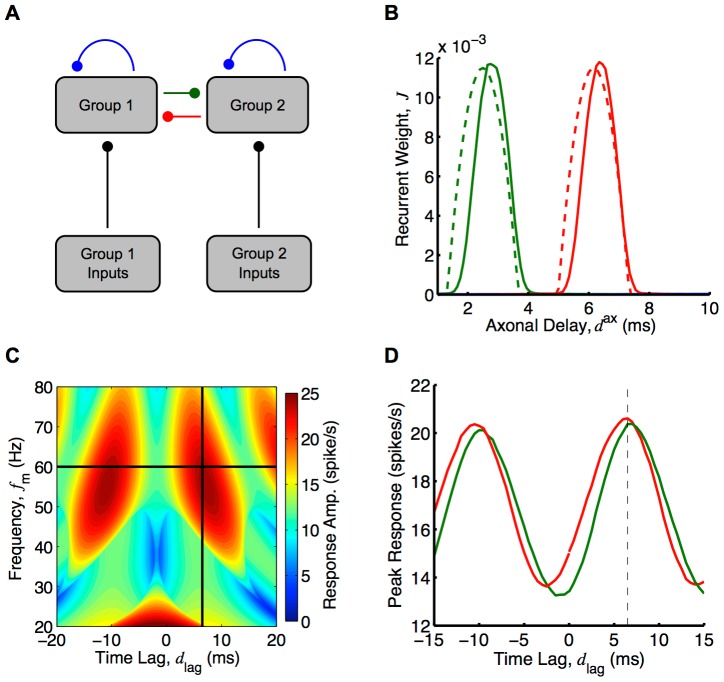
Figure 8. Axonal delay selection between two recurrently connected groups.
(A) Diagram of two group model simplified from Figure 3. (B) Comparison between analytical (dashed) and simulation (solid) for axonal delay profiles between two groups each with oscillatory inputs with a modulation frequency of 60 Hz and where the inputs into group 2 are 6.5 ms behind the inputs into group 1. Analytical result was for 40,000s of learning and as given by Equation (45) and used a ‘slow’ EPSP. Simulation result was for 20,000s of learning with two groups of 5000 LIF neurons each. Shown are the delay profiles for the connections from group 2 to group 1 (red), from group 1 to group 2 (green), and within groups (blue) for which the mean weight for all delays was zero. (C) Analytically determined heat map (Equation (46)) of the mean of the group response amplitudes for different input frequencies and time lags. An EPSP with 1 ms rise time and 3 ms decay time was used instead of the ‘slow’ EPSP (Figure S6C), and recurrent strengths,  and
and  , of 0.9. Black lines represent the training frequency (60 Hz) and time lag (6.5 ms). (D) Peak responses from simulations of group 1 (red) and group 2 (green) for different input time lags at the training frequency (60 Hz), for the network after learning, shown in B. Dashed vertical line represents training time tag. Both B, C and D use a modulation amplitude,
  , of 5 spikes/s, and the analytical plots in B and C used
  , to match the network response to the network response during the simulation with the nonlinear LIF neurons.

