
Figure 2. Comparison of prediction performance of LMM (blue), BVSR (red), and BSLMM (purple) in two simulation scenarios, where all causal SNPs are included in the data.
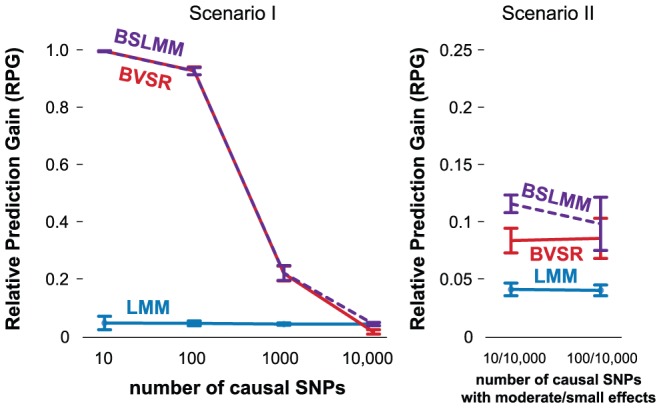
Performance is measured by Relative Predictive Gain (RPG). True PVE = 0.6. Means and standard deviations (error bars) are based on 20 replicates. The x-axis show the number of causal SNPs (Scenario I) or the number of medium/small effect SNPs (Scenario II).