Figure 1.
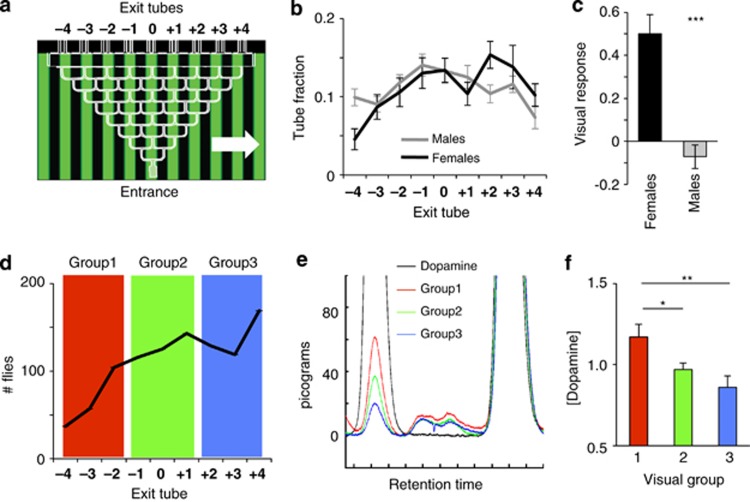
Visual responsiveness. (a) Flies walk through a choice maze while being exposed to moving gratings displayed on a computer monitor beneath them. The direction of grating motion (white arrow) influences their turning decisions at each choice point, and the population distribution among nine exit tubes determines the visual responsiveness of a strain. Positive responses indicate that flies are turning in the same direction as the grating. (b) Fly distributions among the nine exit tubes are plotted (proportion±s.e.m) for male and female wild-type flies (N=200 flies for each, comprising 8 maze runs of 25 flies). (c) VR (±s.e.m.) is calculated as a weighted average of exit tube fractions; *** significantly different responses between males and females, P<0.001, by t-test comparing means (N=8 runs of 25 flies per sex). (d) 999 wild-type female flies were run through the maze on three different days and collected into one of three visual responsiveness groups, depending on which exit tube they emerged from. Flies were immediately frozen for HPLC as they emerged from the maze. (e) Sample HPLC trace for flies from the three behavioural groups, as indicated by colour. Control DA peak is indicated (black). The large peak on the right is the internal standard for each sample. (f) Averaged normalized HPLC data for the three maze groups from (d). Each group includes data from nine different pools of five heads collected on three different days (see Materials and methods). **P<0.01; *P<0.05, by t-test comparing means.

