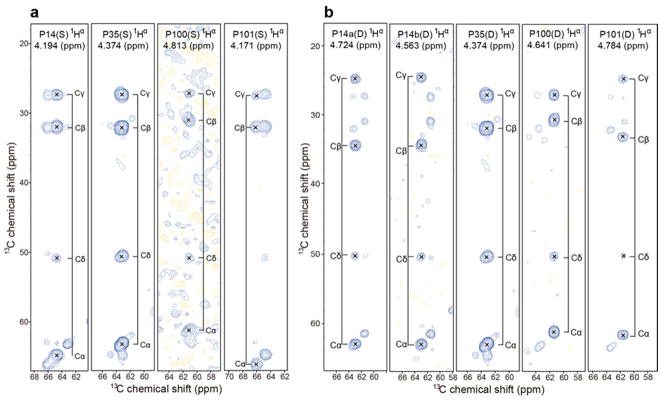
Figure 2.
2D strip plots from 3D (H)CCH-TOCSY spectra of IscU acquired at 600 MHz (1H). The NMR sample contained 1 mM [U-13C, 15N-Pro]-IscU, 50 mM Tris-HCl (pH 8.0), 5 mM DTT, 150 mM NaCl, 50 μM DSS, and 50 μM NaN3 in 10% D2O. 2D strips were taken at the chemical shifts of the prolyl 1Hα, shown at the top of each strip. (a) Spectrum of the S-state of IscU stabilized as the Zn2+ complex at 25 °C. (b) Spectra of the D-state of IscU acquired at 45°C.

