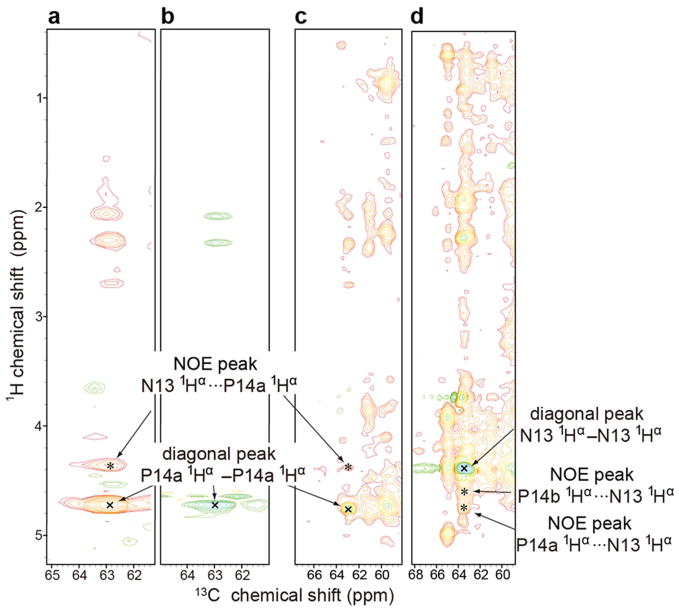
Figure 4.
NMR spectra collected at 900 MHz (1H) at 45 °C where the protein is in the D-state. The NMR samples contained 1 mM protein, 50 mM Tris-HCl (pH 8.0), 0.5 mM EDTA, 5 mM DTT, 150 mM NaCl, 50 μM DSS, and 50 μM NaN3 in 10% D2O. Diagonal peaks are marked by “x” and NOE peaks by “*”. (a) Strip at the P14a 1Hα chemical shift from a 3D 13C-edited 1H-1H NOESY spectrum (mixing time 125 ms) of [U-13C,15N-Pro]-IscU. (b) Strip at the P14a 1Hα chemical shift from a 3D H(C)CH-TOCSY spectrum of [U-13C, 15N-Pro]-IscU. The cross peak matches the 1Hα-13Cα position of the diagonal in panel A. (c) Strip at the P14a 1Hα chemical shift from a 3D 13C-edited 1H-1H NOESY spectrum (mixing time 125 ms) of [U-13C,15N]-IscU. The uniformly labeled sample exhibits cross peaks at the same positions as those from the selectively labeled sample (panel A). (d) Strip at the N13 1Hα chemical shift from a 3D 13C-edited 1H-1H NOESY spectrum (mixing time 125 ms) of [U-13C, 15N]-IscU. Both P14a 1Hα and P14b 1Hα exhibit NOEs with N13 1Hα.

