
Table 1.
T m analyses, kinetic rate constants, and equilibrium affinities for the different hairpin PAs with their cognate DNA sequence.
KA1002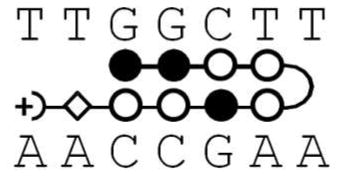
|
KA1007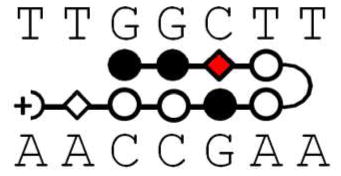
|
KA1055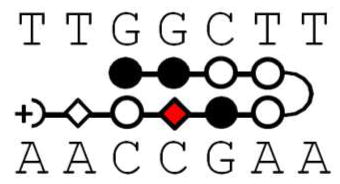
|
KA1039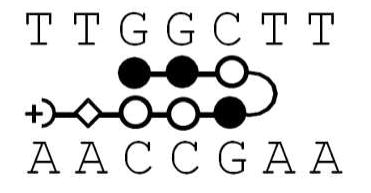
|
|
|---|---|---|---|---|
| ΔTm ± 0.5 °C | 6.8 | 0.6 | 5.3 | 3.2 |
| ka (×106 M−1s−1) | 44 ± 15 | 5 ± 2 | 5 ± 2 | 3 ± 1.5 |
| kd (×10−3 s−1) | 12 ± 2 | 170 ± 10 | 6 ± 1 | 21 ± 5 |
| KA (×108 M−1) | 37 ± 7 | 0.29 ± 0.01 0.27 ± 0.02§ |
12 ± 2 | 1.4 ± 0.2 |
| KD (nM) | 0.3 ± 0.1 | 35 ± 3 | 0.9 ± 0.2 | 7.1 ± 0.7 |
*
The errors in these values are based on experimental reproducibility.
§
Only KA1007 could the KA value be determined by both kinetic (top) and steady-state (bottom) fitting using a single-site binding model (Materials and Methods).