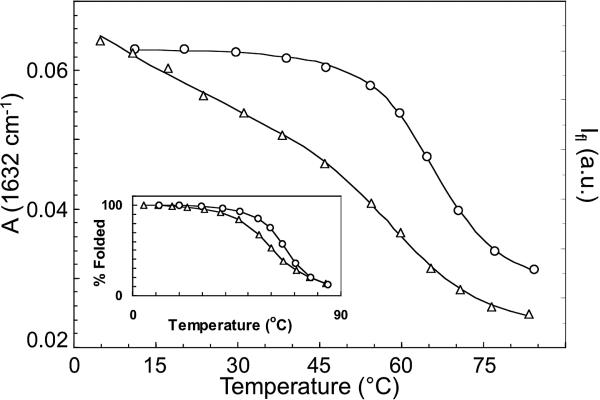
Figure 2.
Thermal denaturation curves of wild-type CspA obtained by measuring the amide I’ absorbance (FTIR) at 1634 cm–1 (○) and the Trp fluorescence (△). The solid lines are fits to an apparent two-state model that yield apparent Tm values of 66 ± 1 and 61 ± 1 °C for IR and fluorescence, respectively. The inset shows an overlay of the background-corrected fluorescence data with the IR data and highlights the difference in apparent Tm values derived from the different probes.

