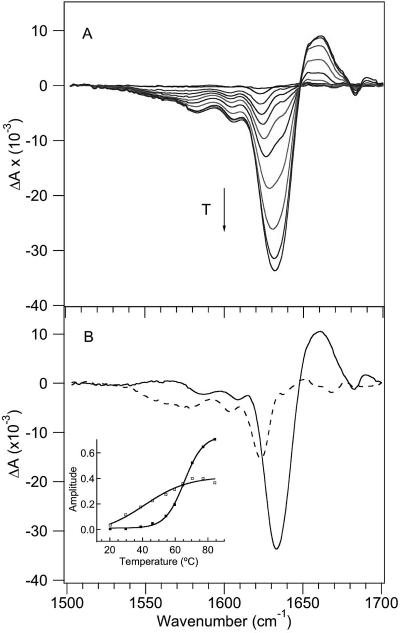
Figure 3.
Temperature-dependent FTIR spectra. (A) FTIR difference spectra in 8 °C increments, generated by subtracting the lowest-temperature spectrum (9 °C) from higher-temperature spectra. The arrow shows the direction of increasing temperature. (B) D spectral components with the corresponding FT temperature profiles (shown as an inset) determined via SVD and global fitting analysis of the temperature-dependent FTIR difference spectra. The first spectral component (—) has a more cooperative transition with an apparent Tm of 66 °C (■), whereas the second spectral component (---) has a broader transition with a lower apparent Tm (□).

