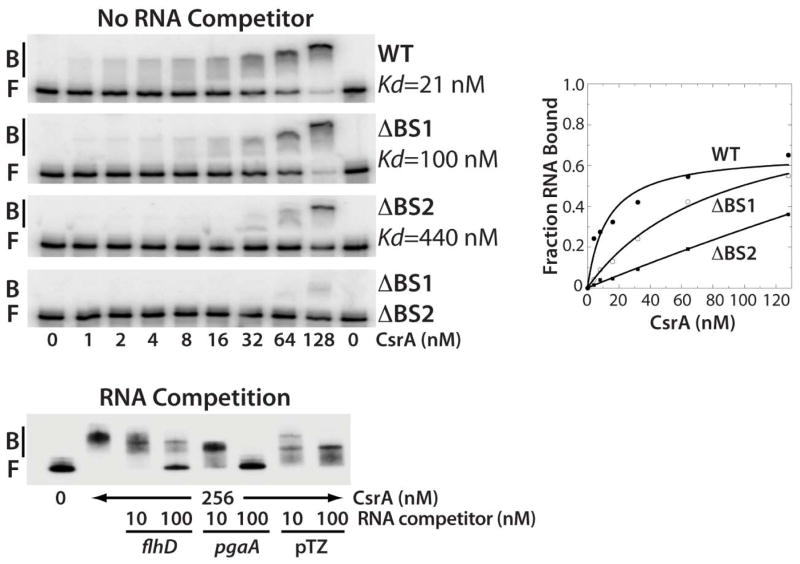
Fig. 2. Gel mobility shift analysis of CsrA-flhDC leader RNA interaction.
5’ end-labeled RNA was incubated with the concentration of CsrA indicated at the bottom of each lane. Positions of bound (B) and free (F) flhDC leader RNA are marked. Kd values of CsrA interaction with wild type (WT), ΔBS1, ΔBS2 and ΔBS1 ΔBS2 mutant transcripts are shown. The simple binding curve for these data is shown at the right. For the RNA competition assay, labeled flhDC leader RNA was incubated with CsrA ± 10- or 100-fold excess of specific (flhD and pgaA) or non-specific (pTZ19R) competitor RNA.

