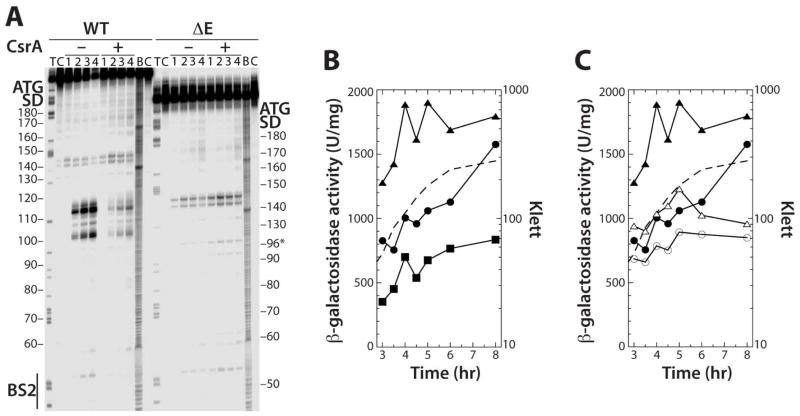
Fig. 8. Effects of deleting RNase E cleavage sites on flhDC expression.
A. 5’ end-labeled WT orΔE RNAs were treated with 4 nM RNase E for 0 (lane 1), 5 (lane 2), 20 (lane 3) or 60 (lane 4) min in the absence (–) or presence (+) of 1 μM CsrA. Partial alkaline hydrolysis (B) and RNase T1 digestion (T) ladders, and control lanes without RNase treatment
(C), are shown. Positions of CsrA binding site 2 (BS2), as well as the flhD Shine-Dalgarno (SD) sequence and start codon are marked.
B. WT, ΔBS1 ΔBS2 and ΔE chromosomally integrated flhD'-'lacZ translational fusions in WT backgrounds were grown in LB at 30°C. Each experiment was performed at least twice and γ-galactosidase values from a representative experiment are shown. Symbols are: WT fusion, solid circles; ΔE fusion, solid triangles; ΔBS1 ΔBS2, solid squares. A representative growth curve is shown with a dashed line.
C. WT and ΔE chromosomally integrated flhD'-'lacZ translational fusions in WT and csrA mutant backgrounds were grown in LB at 30°C. Each experiment was performed at least three times and γ-galactosidase values from a representative experiment are shown. Symbols are: WT fusion, solid circles; WT fusion csrA, open circles; ΔE fusion, solid triangles; ΔE fusion csrA, open triangles. A representative growth curve is shown with a dashed line.

