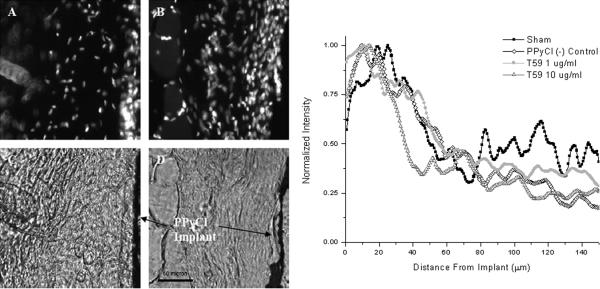
Figure 5.
Representative sections of subcutaneous PPyCl implants. Panels (A) and (C) show PPyCl implant treated with 10 μg/mL T59 while panels (B) and (D) show an untreated control implant. (A) and (B) show the DAPI staining of the sections while (C) and (D) show phase micrographs of PPyCl implants allowing for clear identification of the implant. (E) Normalized intensity profiles of DAPI nuclear stain versus distance from the PPyCl implant. Data was taken from 20 μm thick sections.

