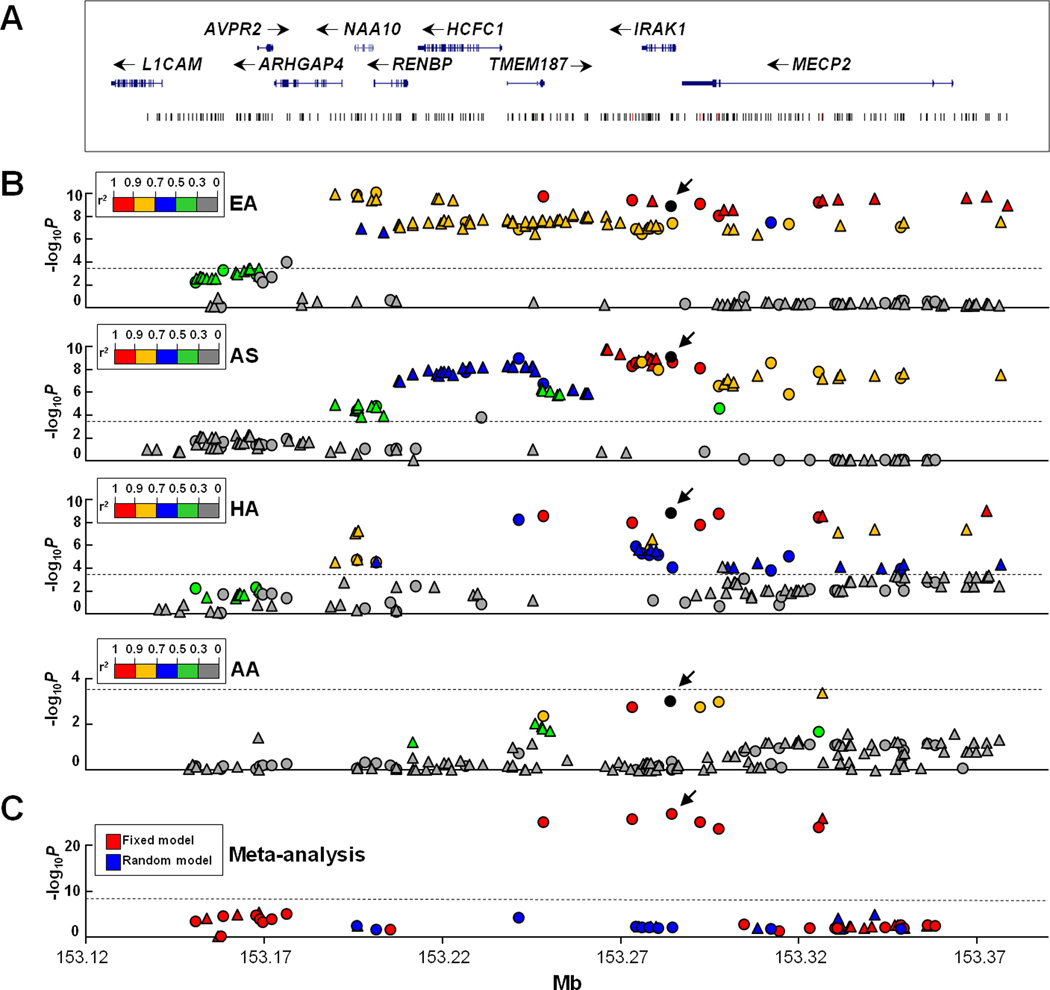
Figure 1. Association of SNPs in the Xq28 region with SLE.
A) The genomic structure of the Xq28 region and the location of all SNPs are indicated. B) Association signals (−log10P) are plotted against the position of each SNP in EA, AS, HA and AA, respectively. Genotyped and imputed SNPs are indicated as circles and triangles, respectively. SNPs are highlighted using different colors according to their LD strength (r2) with rs1059702 (shown as a black circle). An arrowhead is used to indicate the position of rs1059702. The dashed line represents the significance level after Bonferroni correction. C) Trans-ancestry meta-analysis P value generated using fixed and random model are highlighted as red and blue, respectively. The dashed line represents the significance level of 5×10⁻⁸.

