
Figure 3.
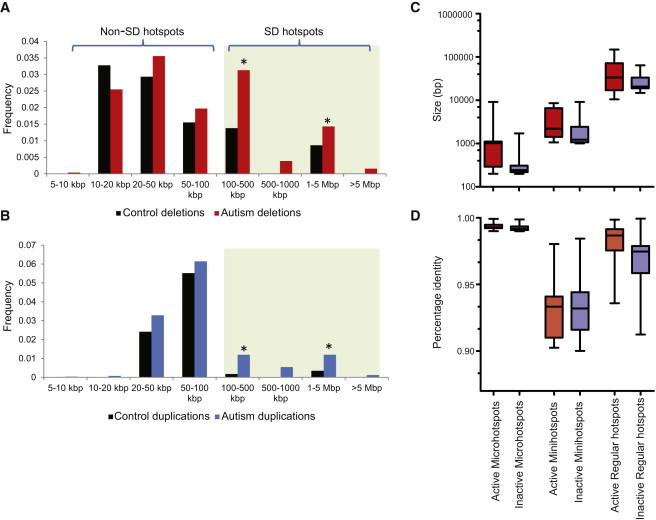
Properties of CNV Hotspots
(A and B) Frequency of deletions (A) and duplications (B) at different size ranges is shown for SD-mediated hotspots and smaller (micro, mini, and AluY) hotspots. Although no enrichment for smaller non-SD hotspots is observed among autistic children, a significant enrichment for larger, SD-mediated CNVs is observed. An asterisk denotes a significant difference (p < 0.05) in cases compared to controls via a Mann-Whitney t test.
(C and D) Sequence properties of genomic hotspots are shown. A comparison of size (C) and sequence identity (D) of repeats flanking “active” hotspots versus “inactive” genomic hotspots. The error bars indicate the minimum and maximum range of the data points.