
Figure 1.
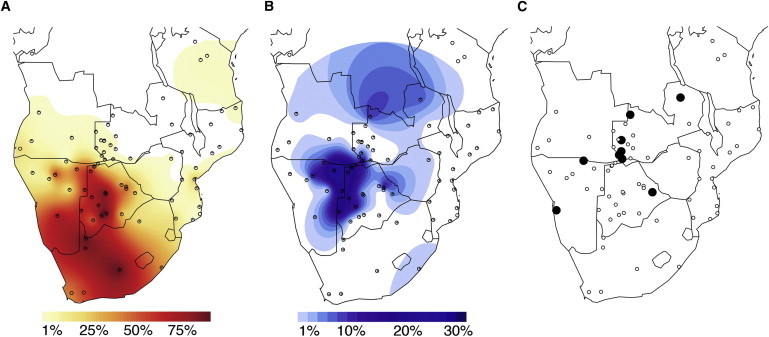
Surfer Maps Displaying the Spatial Distribution of Haplogroup Frequencies
Dots indicate sample locations.
(A) Haplogroup L0d.
(B) Haplogroup L0k. Note that the scale in (B) is different from that in (A).
(C) Presence of haplogroups L0k1b and L0k2 in southern Africa (large black dots). The actual sampling location of one Topnaar Nama individual with haplogroup L0k1b is shown here; in (A) and (B) this individual was included with the general Nama population sample.