
Figure 3.
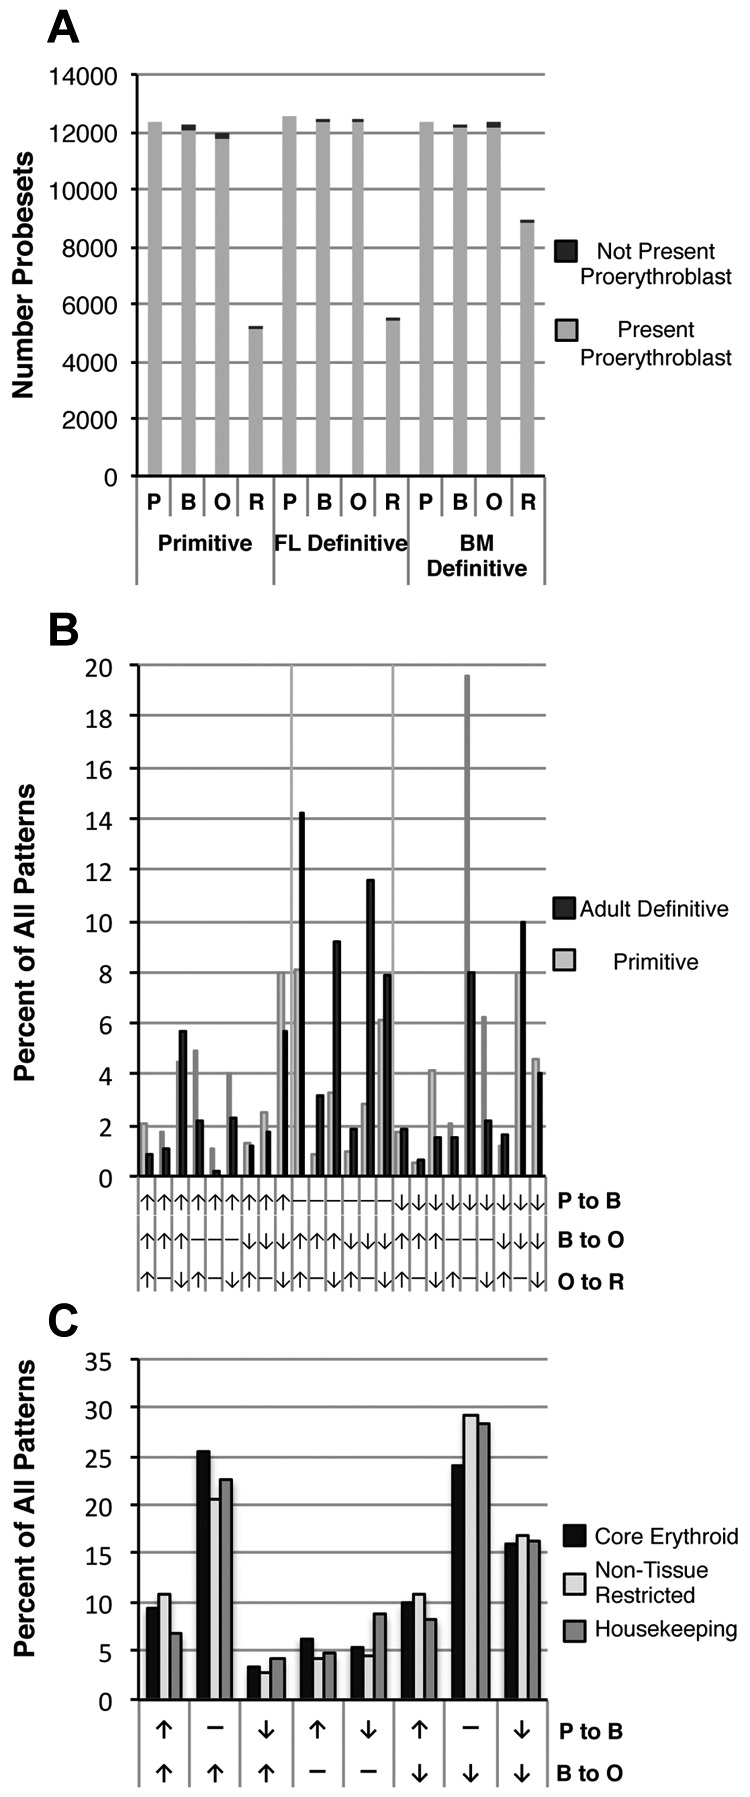
Patterns of gene expression during erythroid precursor maturation. (A) The number of Affymetrix probe sets expressed in each of the 3 erythroid datasets is similar and decreases between the polychromatophilic/orthochromatic erythroblast (O) and reticulocyte (R) stages. Light gray indicates probe sets initially present in proerythroblasts (P), black indicates probe sets present at each subsequent stage that were not present in proerythroblasts. (B) Probe sets were classified by changes in levels between erythroblast stages during primitive erythroid (gray bars) and adult definitive erythroid (black bars) maturation. Twenty-four patterns based on up-regulation (↑), no change (−), or down-regulation (↓) between stages are identified. Vertical grid lines indicate changes between the proerythroblast and basophilic erythroblast stages. Probe sets that did not change among the first 3 stages (−, −, x) are not shown. (C) Comparison of temporal patterns of “core erythroid” (tissue-restricted genes for which expression is shared in the primitive, fetal liver, and adult BM datasets, see “Methods”), “non–tissue-restricted” probe sets (widely expressed in multiple adult tissues, see “Methods”), and housekeeping/maintenance genes35 during erythroid maturation.