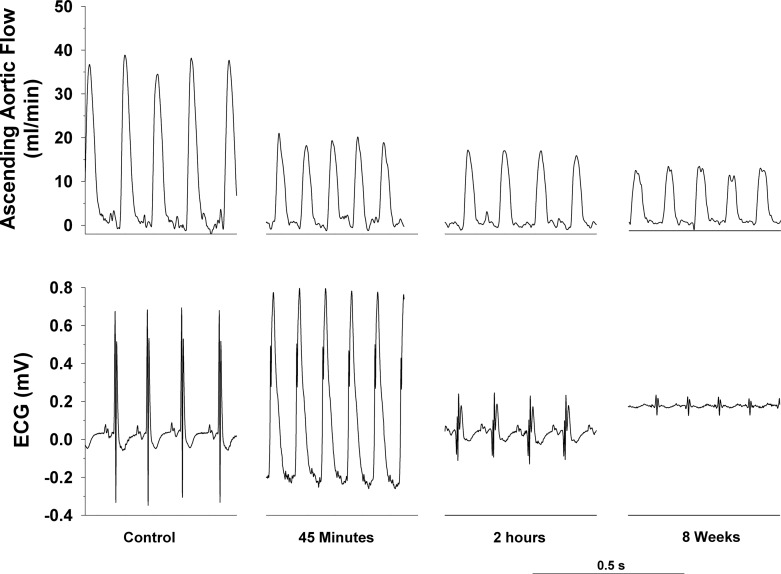
Fig. 4.
Original recordings of ascending aortic blood flow (cardiac output) (top) and the ECG (bottom) before occlusion of the left anterior descending coronary artery (control), at 45 min of occlusion and following 2 h and 8 wk of reperfusion are shown. Coronary artery occlusion reduced cardiac output at all time points. Note the ST-segment elevation at 45 min of occlusion and the pronounced Q-wave and loss of R wave amplitude following 2 h and 8 wk of reperfusion, respectively.

