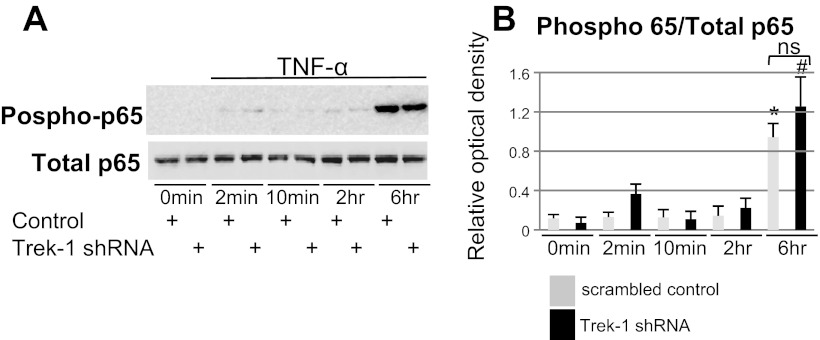
Fig. 3.
Expression and phosphorylation of NF-κB/p65 in MLE-12 cells using Western blot. Total p65 protein expression was unchanged between control and Trek-1-deficient cells. After 6 h of TNF-α stimulation (5 ng/ml), p65 phosphorylation increased equally in control and Trek-1-deficient cells (A). Densitometry analysis of 3 experiments is shown in B. Treatment of cells with TNF-α resulted in increased p65 phosphorylation in both control (*) and Trek-1-deficient cells (#) compared with their respective controls at 0 min (P < 0.05). Phosphorylation of p65 was normalized to total p65 protein and was unchanged between control and Trek-1-deficient cells after 6 h of TNF-α stimulation (ns, not significant, P > 0.05).

