Fig. 7.
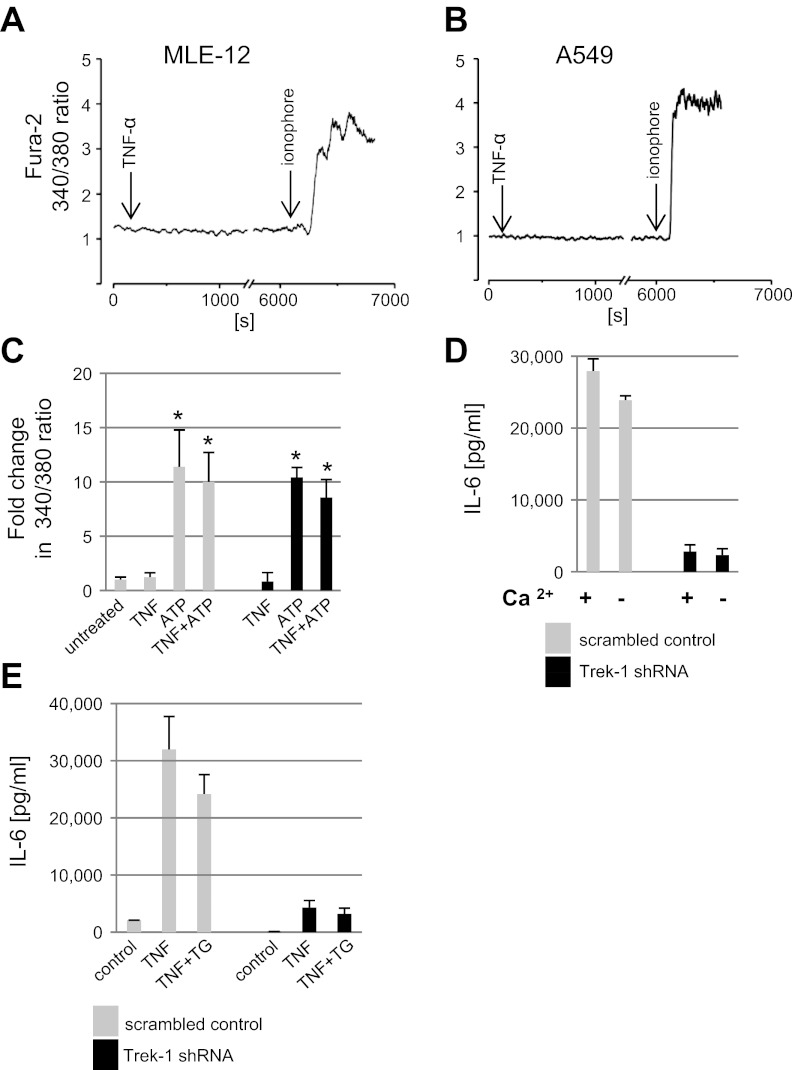
TNF-α did not induce changes in the intracellular Ca2+ concentration. The intracellular Ca2+ concentration of MLE-12 (A, n = 5) and A549 cells was analyzed (B, n = 12) by calculating the fura 2 340/380 nm ratio. TNF-α and ionophore were added at the times indicated by the arrows. Both cell types showed a response to ionophore indicating adequate fura 2 loading. C: data show that ATP-induced intracellular Ca2+ release in A549 cells was not altered by Trek-1 deficiency. Data are depicted as fold change in fura 2 340/380 nm ratio compared with untreated cells (*P < 0.05). The intracellular Ca2+ concentration did not change after addition of TNF-α (5 ng/ml for 6 h) but increased with ATP (10 μM) treatment (P < 0.05, n = 7), and the combination of ATP and TNF-α showed no further increase. The intracellular Ca2+ response to TNF-α (n = 3), ATP (n = 7), and the combination of these two stimuli (n = 3) was similar in Trek-1-deficient and control cells. TNF-α-induced IL-6 secretion from A549 cells was independent of the extra- and intracellular Ca2+ concentration (D and E). Cells were stimulated with TNF-α (5 ng/ml for 6 h) in a 20 mg/dl Ca2+-containing and a low Ca2+-containing culture medium supplemented with 10% FBS (final Ca2+ concentration 1 mg/dl) before IL-6 quantification in the supernatants. Lowering of the extracellular Ca2+ concentration did not affect IL-6 release from either control or Trek-1-deficient cells (D). Similarly, the presence of thapsigargin (TG, 0.5 μM) did not affect TNF-α-induced IL-6 release from either control or Trek-1-deficient cells (E).

