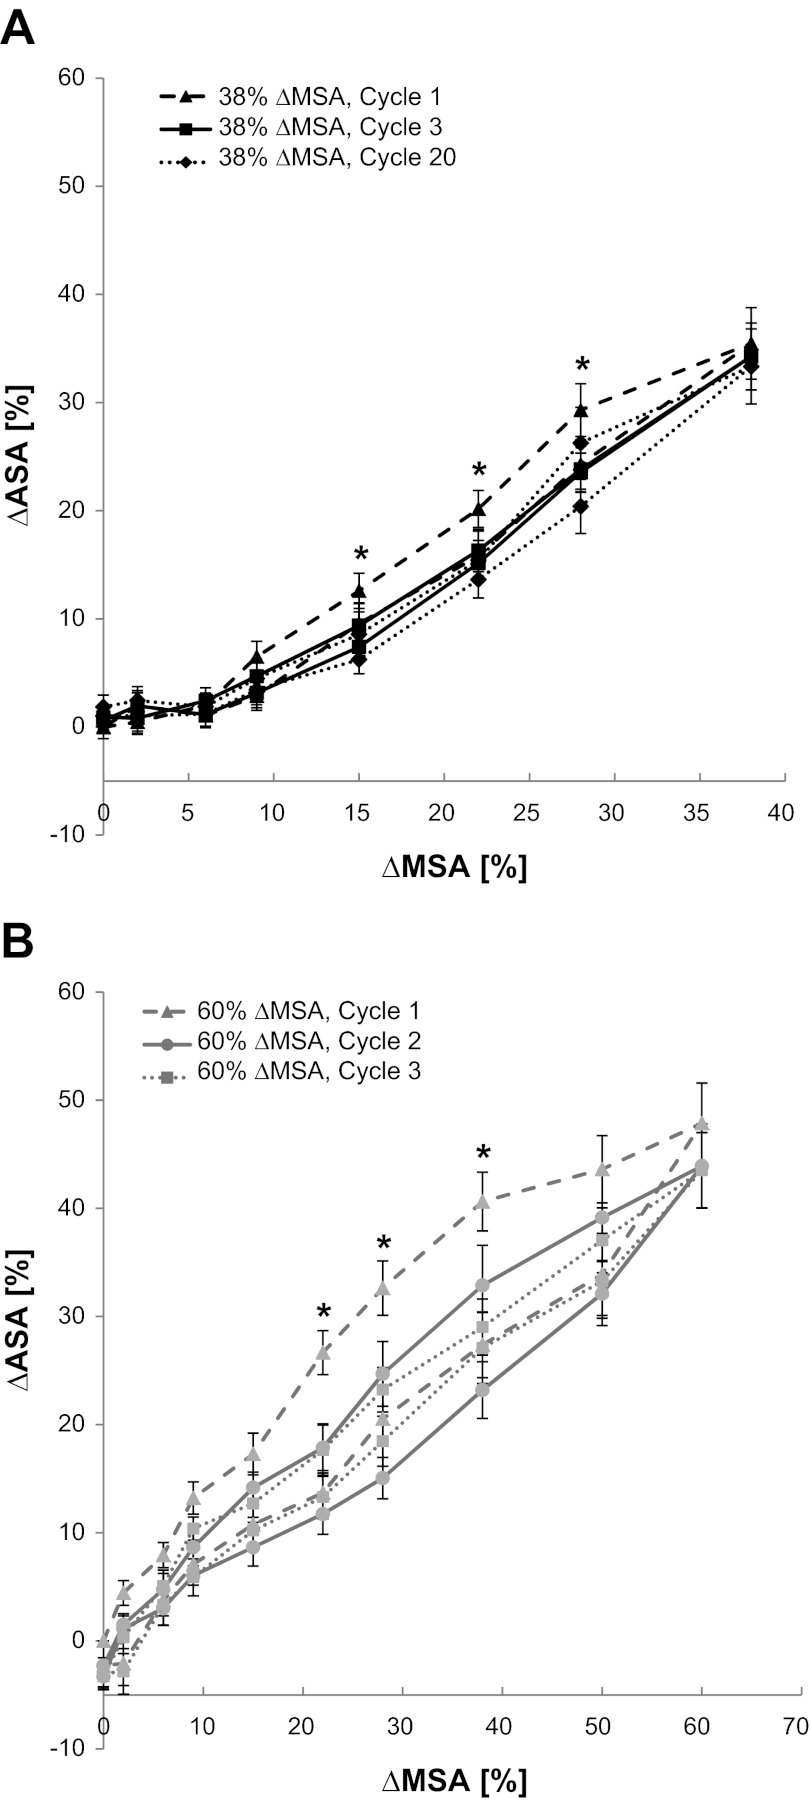
Fig. 5.
Percent change in ASA as a function of the change in the Silastic membrane surface area (%ΔMSA) at cycles 1, 3, and 20 when stretching to a maximal ΔMSA of 38% (A), and cycles 1, 2, and 3 when stretching to a maximal ΔMSA of 60% (B). At several specific %ΔMSA, the estimated %ΔASA in cycle 1 was significantly different than in the other cycles. *For the 38% ΔMSA study, at 15% ΔMSA: F(4,72) = 4.0612, P = 0.0058; at 22% ΔMSA: F(4,72) = 5.3925, P = 0.0010; at 28% ΔMSA: F(4,72) = 6.5550, P = 0.0002. For the 60% ΔMSA study, at 22% ΔMSA: F(2,42) = 12.1827, P = 0.0002; at 28% ΔMSA: F(2,42) = 5.3590, P = 0.0107; at 38% ΔMSA: F(2,42) = 9.0500, P = 0.009. Data are means ± SE.

