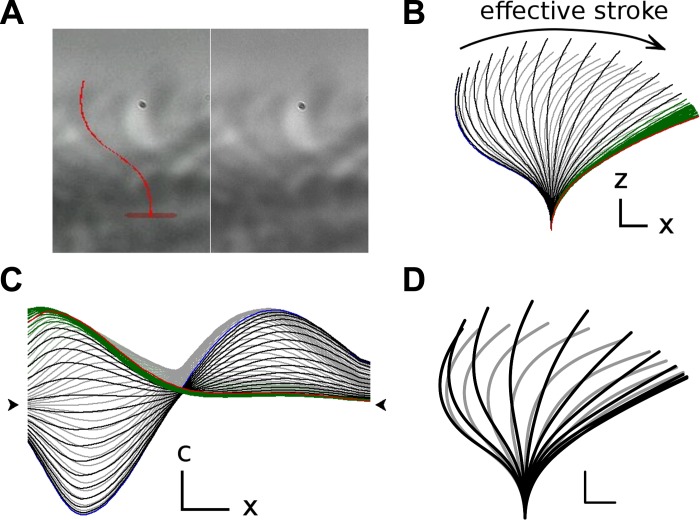
Fig. 3.
Reconstructed waveform. The video image (A) of a ciliated cell was viewed with a superimposed model cilium (here in red at the end-recovery position). Left: image when the fit has been completed. The original image without the superimposed model. The waveform was extracted by looking at the video with the superimposed model and adjusting the parameters to match a 2-Gaussian-based model to the original waveform. The result of the waveform reconstruction was a set of curvature parameters for each time point. The ciliary shapes (B) were then calculated from the curvature data (plotted in C as curvature functions of ciliary length). The recovery, effective, and rest phases are drawn in gray, black, and green, respectively. The graphs corresponding to the end-effective and end-recovery times are drawn in red and blue, respectively. D: composite waveform is plotted. It was generated by averaging the shapes from 11 separate empirical waveforms. Scale bars represent 1 μm (x or z in B, C horizontal) and a 1 μm−1 (c in C vertical). The arrow heads in C designate the level with 0 curvature.

