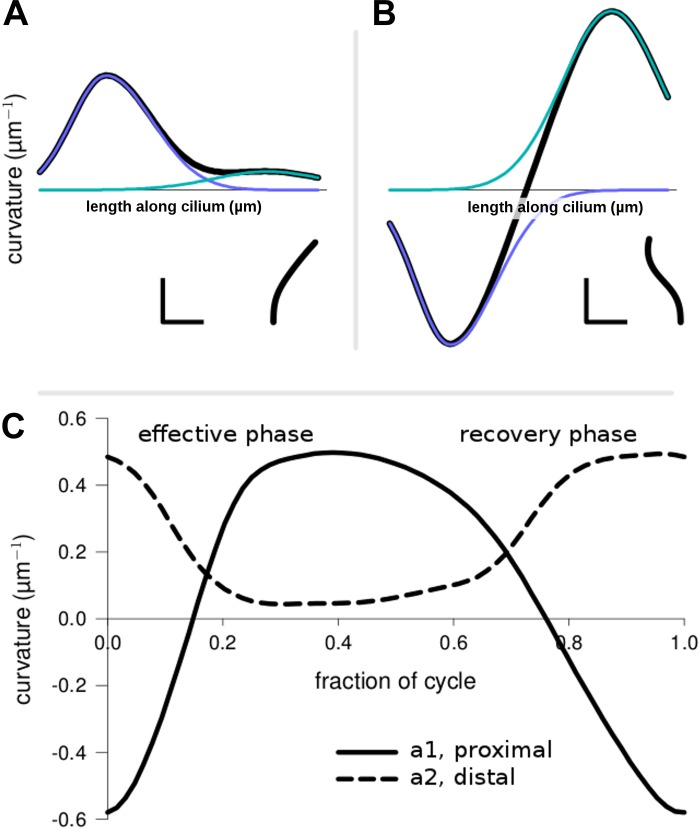
Fig. 6.
Waveform as defined by the 2-Gaussian parameters. A and B: curvature is graphed as a function of length along the cilium for 2 different shapes. Inset: corresponding shape. The proximal (blue) and distal (green) Gaussian curves are defined by the parameters in Eq. 1. The scale bars are 1 μm (horizontal) and 1 μm−1 (vertical). C: most important parameters, curvature amplitudes (ai) during the effective and recovery strokes, are plotted over 1 cycle. The graph starts at the end-recovery position when a parameters had large magnitudes and opposite signs. For this waveform, the a2 parameter never became negative, which was the case with most extracted waveforms.

