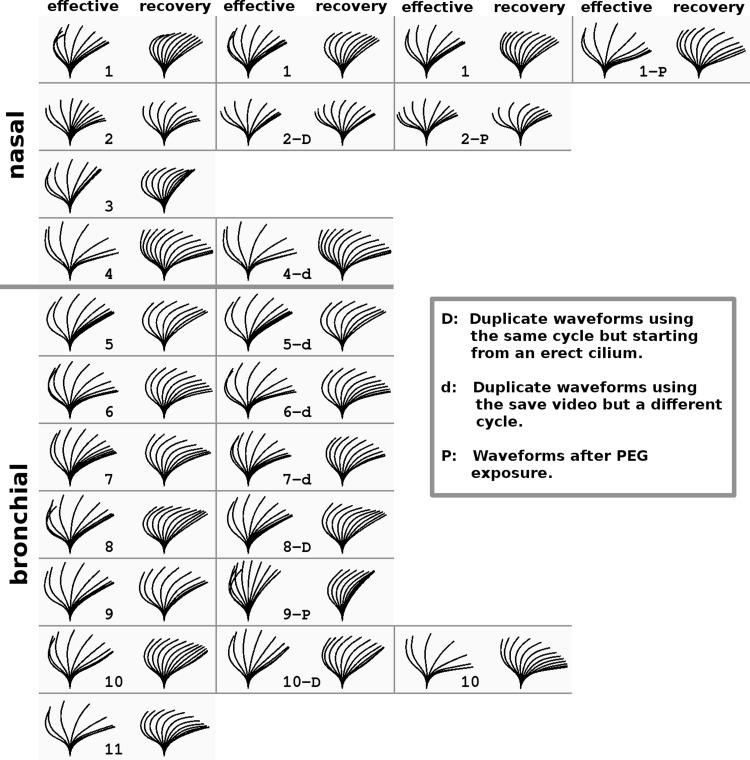
Fig. 7.
Eleven cultures were used to create the composite waveform. In addition, the cultures were refitted after imaging in different places and conditions. Also, some cycles were fitted twice, keeping the model cilium in the same position but starting from a constant vertical cilium. Each waveform is shown in a bordered panel with the effective phase on the left and the recovery phase on the right. The cultures are numbered sequentially in the panels with all the nasal cultures presented first and separated from the bronchial cultures with a double panel border. Two panels with identical culture labels refer to 2 fittings from different videos of the culture done at different times. In addition, some panels have a culture number followed by -d, -D, or -P and refer to a change to be compared with the waveform in the adjacent panel to the left. Duplicate fits (-d) done on the same video but using a different cycle show the variability due inherent in the cycle and in having to reposition the cilium (Cultures 4−7). Sometimes no useful change in the waveform was found. Duplicate fits (-D) done on the exact same cycle but starting from a constant vertical cilium describe the variability that comes purely from the user attempting to fit the cilium to a particular motion seen in the video (Cultures 2, 8, and 10). Duplicate fits (-P) that were done on a culture after it was exposed to polyethylene glycol (PEG, MW 8 × 10³) have videos in the Supplemental Videos that show how PEG tends to increase coordination of cilia, making an accurate fitting of PEG-exposed cilia easier than for cilia beating in plain buffer. Each of the videos shows the culture before PEG exposure and then after. Culture 1-P (Supplemental Video 7) shows the cilia during the washout of 40% PEG, which completely stopped motion. Culture 2-P (Supplemental Video 8) shows cilia exposed to 15% PEG. They are very easy to track, but the PEG has caused excessive clumping of cilia. Culture 9-P (Supplemental Video 9) shows cilia exposed to 30%. This was an almost ideal exposure; the ciliary coordination was greatly improved without the clumping seen in Culture 2-P even though the PEG concentration was higher. Other culture-specific factors may have been responsible for the differences seen.

