
Fig. 3.
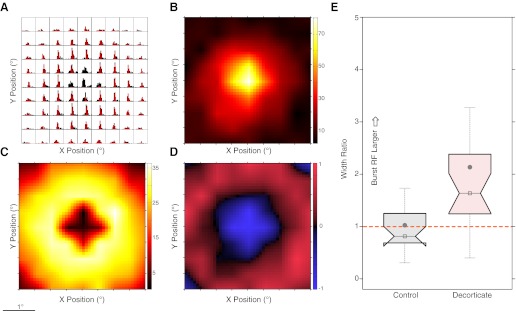
Decorticate burst-tonic differences across visual space. A: peristimulus time histograms (PSTH), each position representing steps of 0.5° across visual space, with red-to-black ratio showing the proportion of burst to tonic spikes for each bin. Y-axis maximum = 280 Hz. B: response surface for tonic spikes alone. Color bar represents firing rate in Hz. C: response surface for burst spikes alone. Color bar represents firing rate in Hz. D: normalized burst-tonic surface where −1 (blue) is tonic spikes only and + 1 (red) is burst spikes only. E: population box-notch plots of the width (Gaussian σ) ratio derived from burst-tonic RF fits. Gray filled circle, mean; open box/horizontal line, median. Notch limits signify the 95% CI of the median; box limits signify 25th and 75th percentiles of the data. Dashed orange line signifies unity (no difference between tonic and burst).