
Fig. 6.
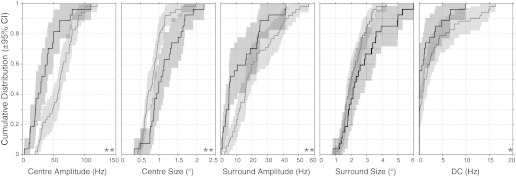
CDF plots for control (gray) and decorticate (black) populations along with the 95% CIs (shading) for the principal DOG model parameters. **P < 0.01, *P < 0.05, significant population difference between control and decorticate cells.
Official websites use .gov
A
.gov website belongs to an official
government organization in the United States.
Secure .gov websites use HTTPS
A lock (
) or https:// means you've safely
connected to the .gov website. Share sensitive
information only on official, secure websites.
CDF plots for control (gray) and decorticate (black) populations along with the 95% CIs (shading) for the principal DOG model parameters. **P < 0.01, *P < 0.05, significant population difference between control and decorticate cells.