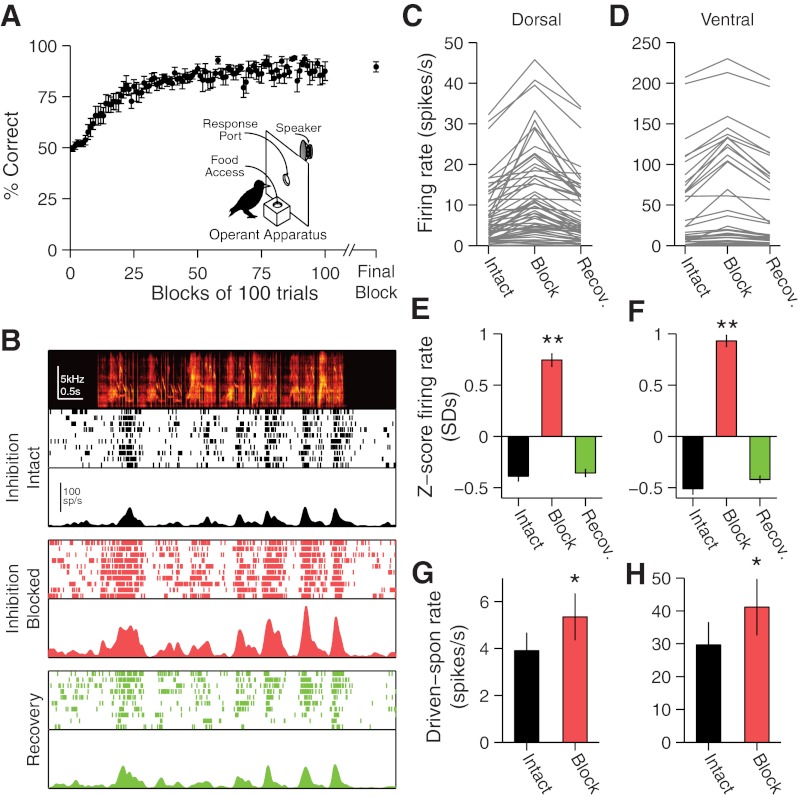
Fig. 1.
Behavioral training and gabazine iontophoresis. A: behavioral acquisition curve for the song-recognition task shows mean (±SE) percent correct (across subjects) for each consecutive 100-trial block during initial training and each subject's final 100 trials. Inset: schematic of behavioral training apparatus. B: effects of iontophoretic application of gabazine on neural responses at a multiunit (MU) caudomedial nidopallium (NCM) site. Top: song spectrogram, raster, and poststimulus time histogram (PSTH) of response with inhibition intact. Middle: raster and PSTH of response with inhibition blocked. Bottom: raster and PSTH of response during recovery from gabazine application. C and D: mean-driven firing rates when inhibition is intact and blocked and during recovery (Recov.) for all sites in dorsal (C) and ventral (D) NCM. E and F: normalized mean firing rates in intact, blocked, and recovery conditions for dorsal (E) and ventral (F) NCM sites. Repeated measures ANOVA: **P < 1 × 10⁻¹⁵. G and H: evoked response [song-driven − spontaneous (spon) firing rates] with local inhibition intact and blocked in dorsal (G) and ventral (H) NCM. Paired t-tests: *P < 5 × 10⁻⁴.

