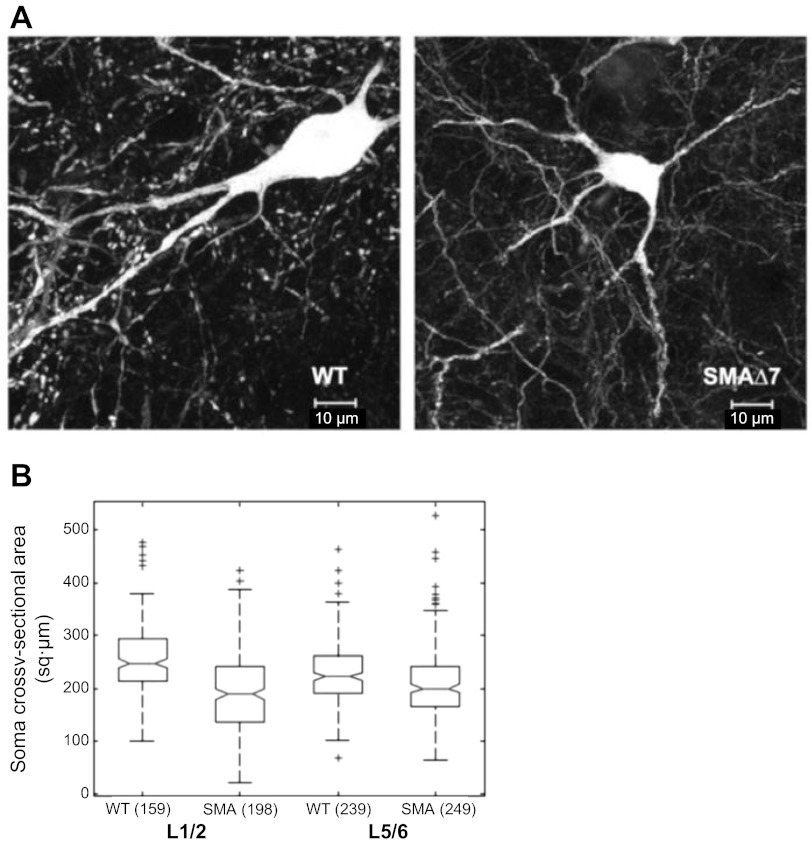
Fig. 2.
Somatic area of calbindin+ neurons is reduced in SMAΔ7 mice. A: calbindin+ somata visualized by their calbindin immunoreactivity in wild-type (left) and SMAΔ7 (right) mice at the L1/L2 segmental level. B: median and interquartile range (IQR) of somatic area in wild-type and SMAΔ7 mice in L1–L2 and L5–L6 regions.; + symbols denote outliers. Numbers in parentheses indicate the number of somata that were counted.

