Fig. 3.
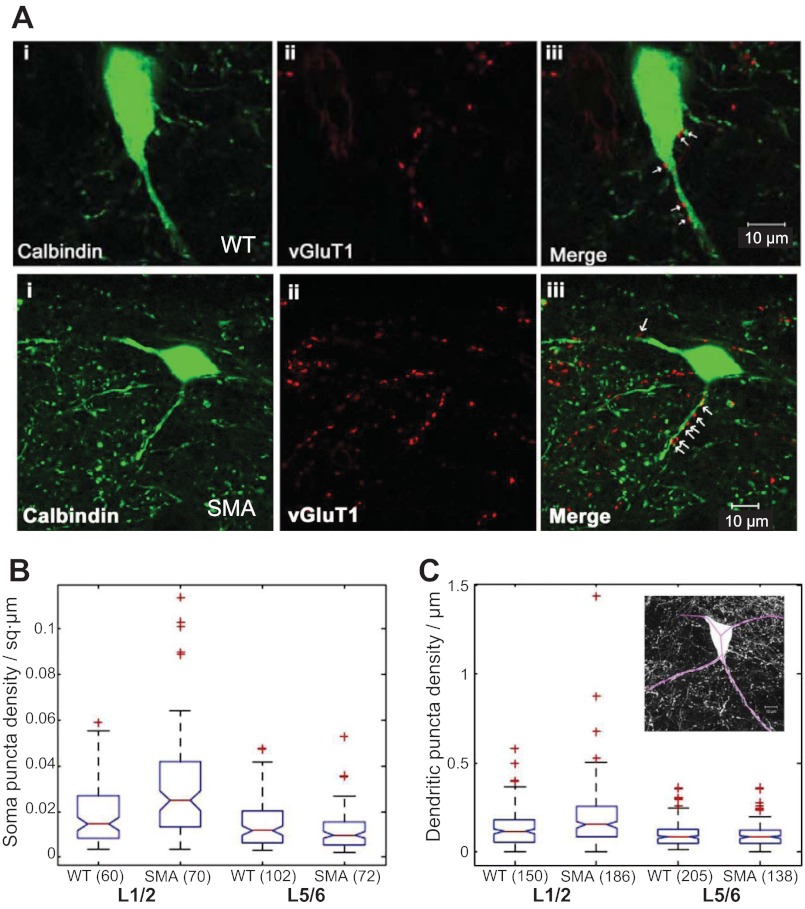
Number of glutamate vesicular transporter (VGLUT1+) terminals is not reduced on calbindin+ cells in SMAΔ7 mice at P12–13. A, top: calbindin+ cell (i), VGLUT1+ terminals (ii), and a merged image (iii) at the L1/L2 segmental level of a wild-type mouse at P12–13. A, bottom: the same immunocytochemistry for a calbindin+ cell from an SMAΔ7 mouse at postnatal day (P)12–13. Arrows in iii show VGLUT1 puncta apposed to the calbindin+ somata and dendrites. Images are generated from a single optical section (0.54 μm). B: Box plots showing medians and IQRs of somatic VGLUT1 puncta in wild-type and SMAΔ7 mice in the L1–L2 and L5–L6 regions. C: box plots showing medians and IQRs of dendritic VGLUT1 puncta in wild-type and SMAΔ7 mice in the L1–L2 and L5–L6 regions. Inset: maximal projection of the wild-type neuron shown in A with the traced dendrites (purple lines) superimposed. Only the calbindin channel is shown for clarity. Numbers in parentheses indicate the number of somata (B) or dendrites (C) that were used to generate the graph. In both B and C, + symbols denote outliers.

