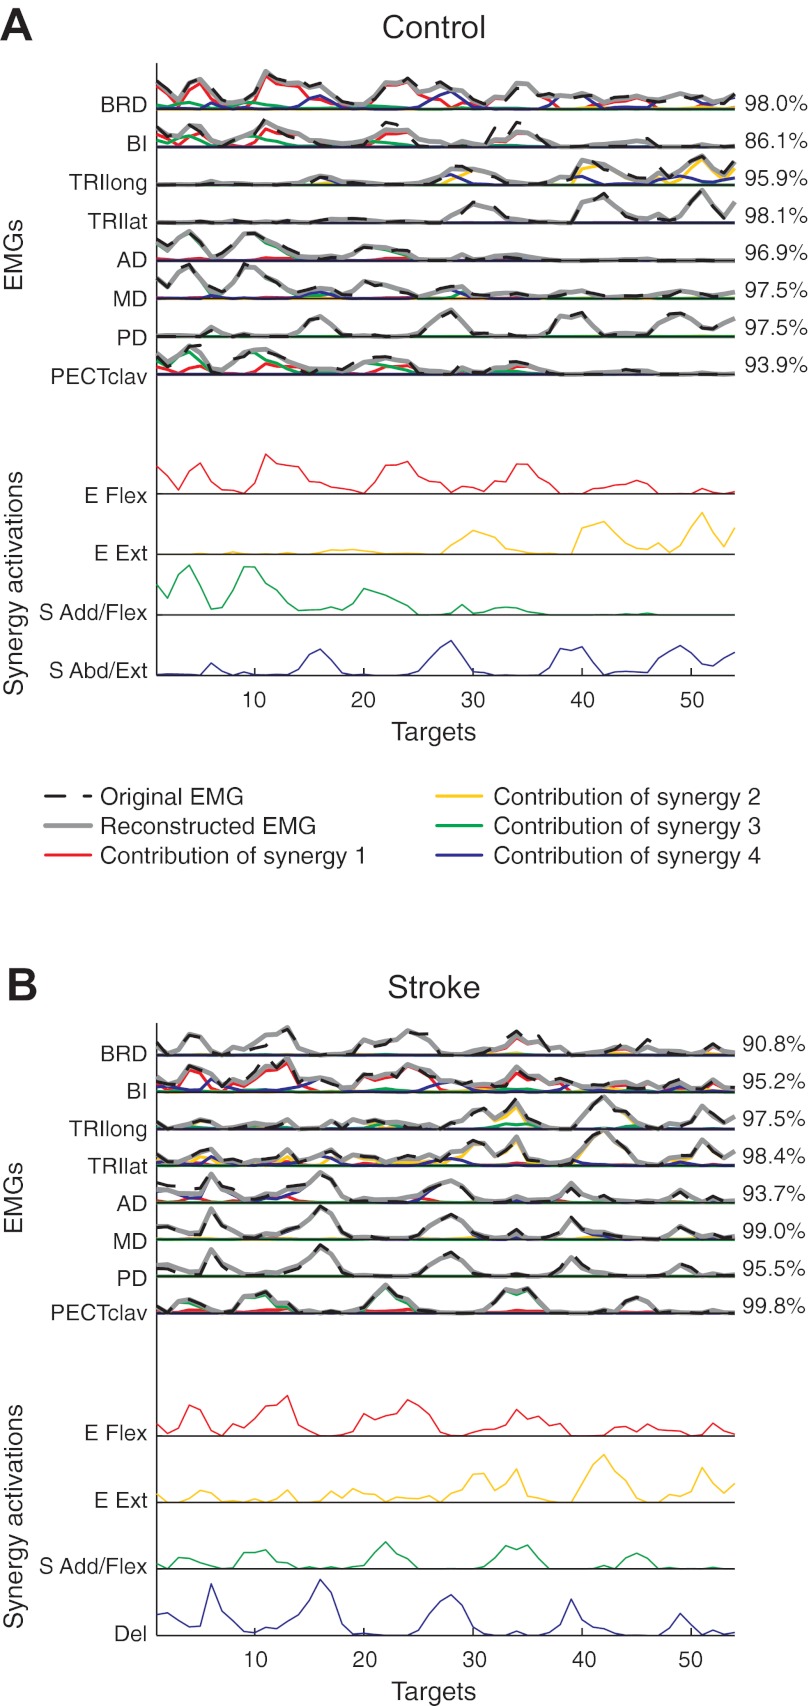
Fig. 6.
Reconstruction of EMGs by linear combinations of 4 synergies for a control and poststroke participant (A and B), respectively. Original EMGs (dashed black lines), reconstructed data (solid gray lines), and contribution of each muscle synergy (common color scheme used for associated synergies in Fig. 5, A and B) to the reconstruction are shown. Muscle VAF value is indicated for each muscle. All trials are ordered along the x-axis in the trial sequence shown in Fig. 2, A and C (see Fig. 2 for the associated force components).

