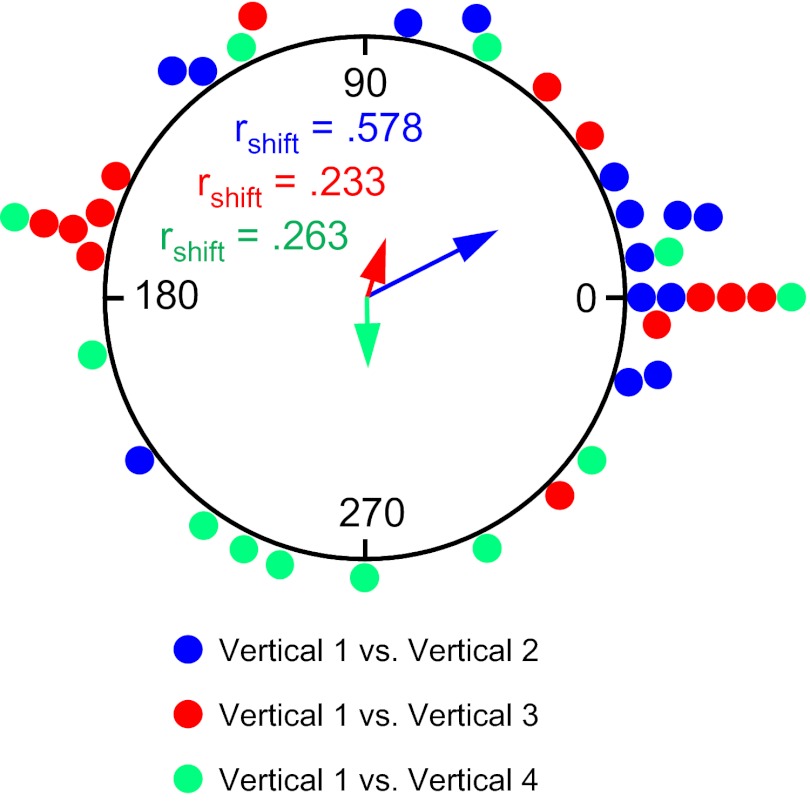
Fig. 11.
Experiment 2. Circular histogram showing the distribution of shifts in preferred firing direction between the Vertical 1 session and each of the subsequent Vertical 2–4 sessions. The mean vector length (rshift) and Ø are shown for each distribution. The vertical platform was used as the reference frame (as opposed to room coordinates) for all Vertical sessions. Note the scattered distribution of points compared with Fig. 4B, indicating that the reference frame the animals used was not the platform—otherwise, the points would have clustered around zero.

