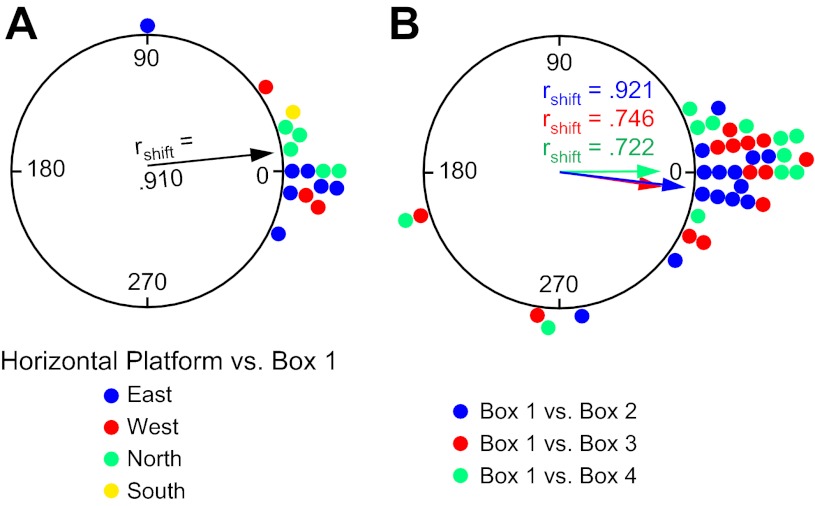
Fig. 9.
Experiment 2. A: circular histogram showing the distribution of shifts in preferred firing direction between the Horizontal-Platform and Box 1 sessions. Color denotes which wall the box and vertical platform were located along for the Box 1/Vertical 1 session. B: circular histogram showing the distribution of shifts in preferred firing direction between the Box 1 session and each of the subsequent Box 2–4 sessions. The mean vector length (rshift) and Ø are shown for each distribution.

