
Fig. 13.
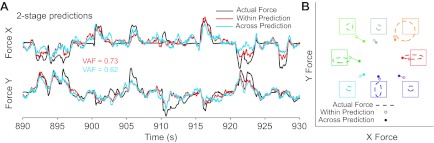
Two-stage predictions of force in the prone posture. All plotting conventions are as in Fig. 12. Within-posture predictions are equivalent to those shown in Fig. 12. In contrast, the cross-posture predictions used the midposture, neuron-to-EMG decoder to predict EMG but the prone (i.e., within posture) EMG-to-force decoder. This two-stage approach revealed that the failure of force prediction generalization across postures (Fig. 12, A and C) was actually the result of the final, EMG-to-force decoder stage. A: continuous time plots. B: mean target hold time plots.