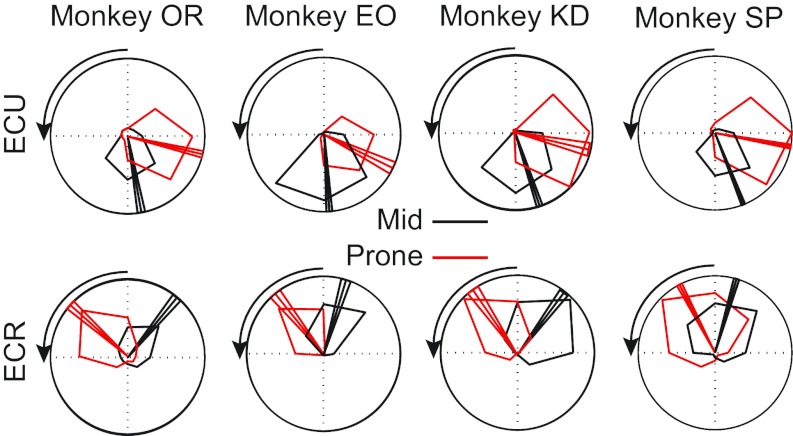
Fig. 3.
Tuning curves expressing the level of muscle activity as a function of the direction of isometric force. Tuning curves are shown for two different muscles, ECU (top) and ECR (bottom), for each of four monkeys. The scale of the outer ring is the maximum activation recorded for each monkey and muscle. Forearm posture is indicated by the color of the curves, including the mid (black) and prone (red) forearm postures. The tuning curves are plotted in extrinsic coordinates from the monkey's perspective, such that upward targets required the monkey to generate upward forces in extrinsic coordinates. The arrow indicates the direction of rotation of the wrist from mid to prone. The PD and ±95% confidence bounds are indicated by the three radial vectors on each plot.

