
Fig. 4.
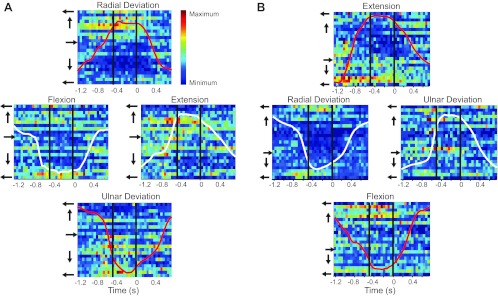
Raster display of activity of 23 simultaneously recorded neurons from monkey OR. The activity of the well-tuned (R2 > 0.62), high-confidence (better than ±25°) neurons was aligned to the time of reward and averaged over 20 trials for targets in each of the 4 cardinal directions in the midposture (A) and prone posture (B). Here, target hold time and PD measurement period are indicated by the vertical black lines. Neurons were sorted by PD, as indicated by the arrows to the left of the rasters. The firing rate for each neuron was normalized to its peak and plotted such that red is the maximum and blue is the minimum firing rate. Curves on each panel denote force magnitude of the left-right (white) and up-down (red) axes.