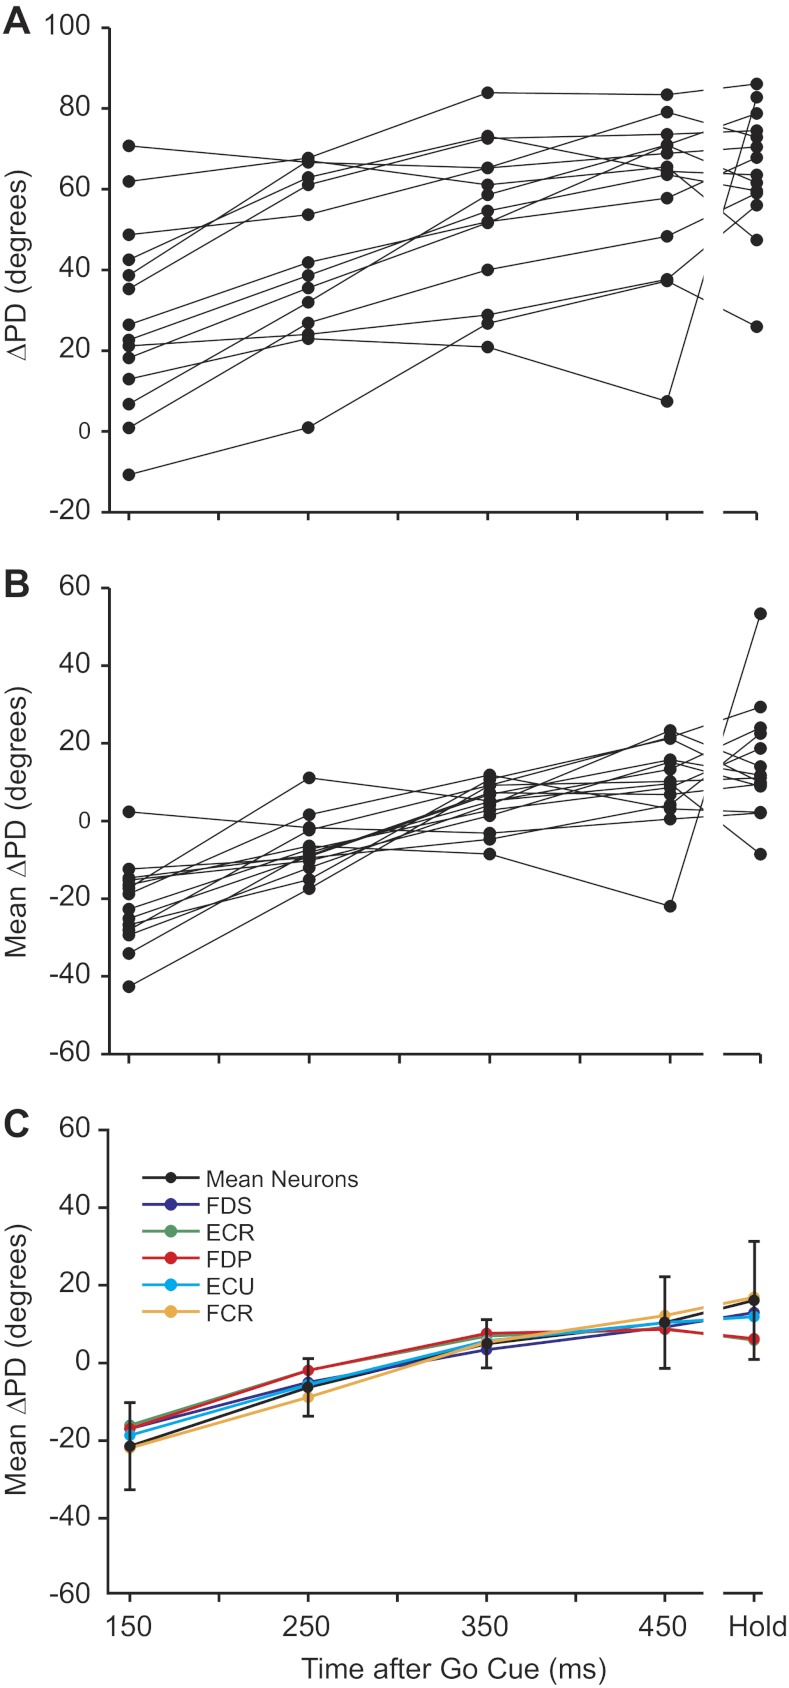
Fig. 8.
Change in ΔPD throughout the trial. A: ΔPDs for neurons from monkey KD were plotted as a function of the time after the go cue (150 ms corresponds approximately to the movement onset). Only neurons that had high PD confidence for all of the measurement periods were included. B: to better observe the functional relation between ΔPD and time, we subtracted the mean ΔPD from each neuron curve. C: the same calculations were made for the muscles using measurements made 50 ms later than the corresponding neuronal measurements to preserve the temporal relation between the two types of signals. The individual muscle curves are plotted in color, whereas the average, shifted neuron ΔPD is plotted in black (±1 SD).

