Fig. 4.
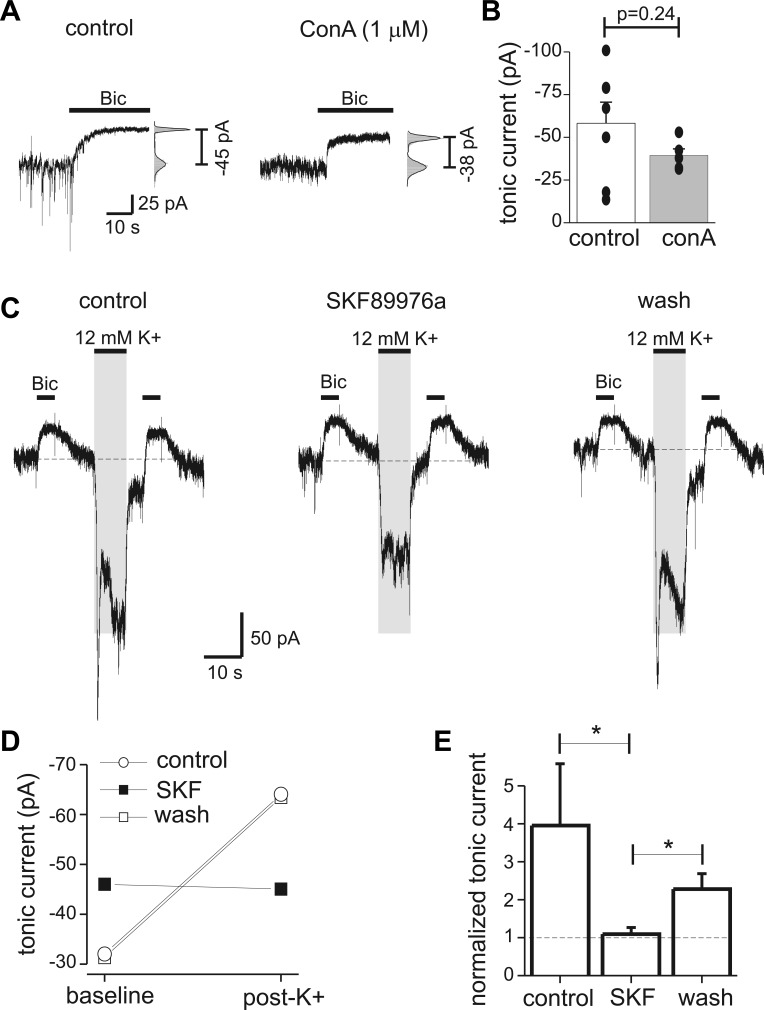
Nonvesicular GABA release potentiated tonic currents. A: endogenous tonic currents measured with Bic in a control neuron and a neuron pretreated with concanamycin A (ConA; 1 μM for 2 h). At right, an all-points histogram shows fit with a Gaussian function used to determine tonic current amplitude. B: mean tonic current from control neurons and neurons treated with ConA. Filled circles represent individual measurements (n = 5–7 cells for each condition). ConA treatment greatly reduced spontaneous synaptic currents but did not significantly affect tonic currents. C: measurement of tonic currents before and after depolarization of presynaptic neurons with 12 mM K+. Tonic currents measured 5 s after the K+ application were increased, and this potentiation was reversibly inhibited by the GABA transporter type 1 (GAT1) antagonist SKF89976a (SKF; 40 μM). Shaded area indicates timing of K+ application; solution exchange times were fast, so it is expected that the wash of high-K+ solution was complete before tonic current measurement. Dashed horizontal lines indicate baseline holding current for reference. Vesicular GABA release was inhibited by pretreatment with ConA; holding potential was −60 mV. D: tonic current amplitudes before (pre-K) and after (post-K) application of 12 mM K+ from experiment in C. GAT1 antagonism increased baseline tonic current amplitude but also prevented the increase in tonic currents by K+-induced nonvesicular release. E: mean values for normalized tonic current under control conditions, with SKF, and after wash (n = 4). *P < 0.05.

