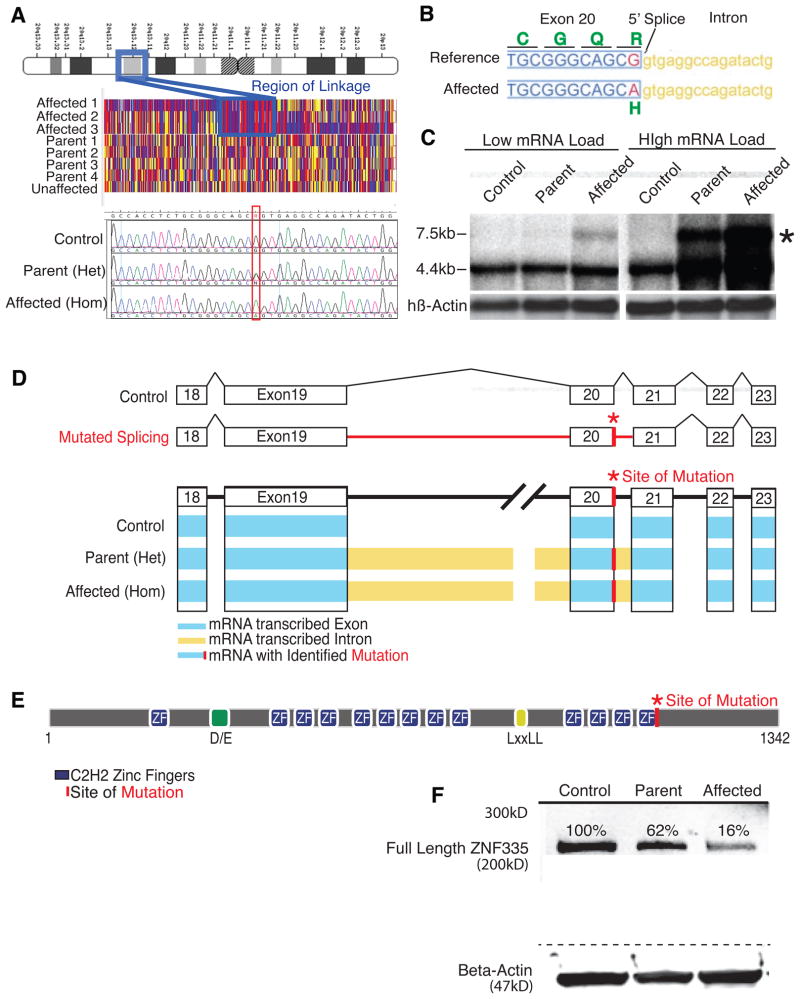
Figure 2. Severe microcephaly reflects a splicing/missense mutation ZNF335.
(A) Patients show linkage at chromosome 20q13.12. Sequencing shows a c.3332g>a mutation in gene ZNF335. Upper panel: schematic of chromosome 20. Middle panel: single nucleotide polymorphism genotyping. Each column represents a SNP, and the red and blue indicate homozygosity, whereas yellow shows heterozygosity. A large region (boxed) shows mainly red and blue SNPs in affected patients with heterozygosity in parents. Bottom panel: representative sequencing data.
(B) Mutation is at 5′ Splice site of ZNF335 and leads to R1111>H missense mutation.
(C) Northern blot shows production of a new larger transcript (*) in heterozygous parents and homozygous patients.
(D) Schematic of exons and intronic splicing for a control and the predicted problems with intronic splicing in a patient with a c.3332g>a mutation. Schematic of RNA-sequencing data shows detection of reads within exons (blue), and within introns (yellow) upstream and downstream of the mutation-containing exon. Incomplete splicing is present in heterozygous parents and homozygous patients but not in control cells. RNA-sequencing data also detected the base change mutation (*).
(E) Predicted structure of ZNF335. Mutation lies in the last zinc finger motif.
(F) Western blot of patient lymphoblast cell lines show heterozygous parents and homozygous patients produce a reduced amount of full length ZNF335 protein, and no evidence of larger or degraded protein products.
See also Fig S1.

