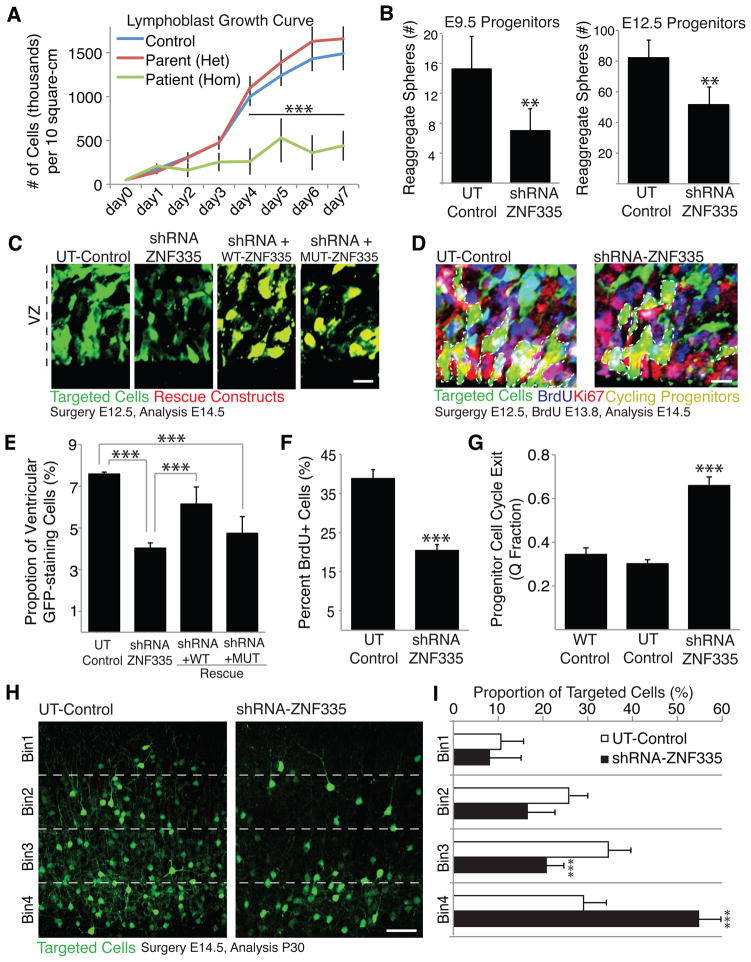
Figure 4. Znf335 is essential for progenitor cell proliferation and cell cycle maintenance.
(A) Growth curves of lymphoblast cell lines derived from heterozygous parent, homozygous patient and control shows decreased growth rate in cells from patient with low levels of mutated ZNF335.
(B) Knockdown of Znf335 leads to decreased formation of progenitor cell reaggregates in E9.5 and E12.5 progenitor cell cultures showing decreased proliferation upon knockdown of Znf335. E9.5: UT-Control, 15.25 +/− 4.3; ShRNA-ZNF335, 7.1 +/−2.9, T-test, p=0.0032, n=6; E12.5 UT-Control, 82.2 +/− 11.5; ShRNA-ZNF335, 51.6+/− 11.6, Data are representated as mean +/−SD. T-Test, p=0.001; n=6 rounds of FACS sorting. Each sort is from pooled embryos from 3 different dams with roughly half of their embryos electroporated with either shRNA-Znf335 or UT-control constructs.
(C) shRNA-ZNF335 knockdown leads to fewer cells present within the ventricular zone when compared to UT-Control. WT-ZNF335 rescues the number of progenitors but MUT-ZNF335 does not. Scale: 10μm.
(D) shRNA-ZNF335 knockdown leads to fewer cycling progenitors in the ventricular zone as compared to the UT-Control. Scale: 10μm.
(E) Quantification of 4C. Knockdown of Znf335 leads to fewer percentage of targeted cells present within 250μm2 of the ventricular zone as compared to UT-Control. WT-ZNF335 rescues the amount of GFP-staining cells in the VZ while MUT does not. UT-Control: 7.59 +/− 0.09; ShRNA-ZNF335: 4.0 +/− 0.25; shRNA+WT: 6.27 +/− 0.7; shRNA+MUT: 4.74 +/− 0.8, mean+/−SD, T-test, P=0.0001; n=12 means of different electroporated litters.
(F) Knockdown of Znf335 leads to fewer cells that are BrdU positive 48hours post knockdown within 50μm2 of the ventricular zone as compared to UT-Control. UT-Control: 38.8 +/− 2.9; shRNA-ZNF335: 20.4 +/− 1.7, mean +/−SEM, T-test, P=0.0001; n=12 electroporated brains that were analyzed using serial sections).
(G) Knockdown of Znf335 leads to increased cell cycle exit (decreased BrdU+/Ki67+ cells out of total BrdU+ cells) as compared to UT-Control. (WT-Control: 0.34 +/− 0.03; UT-Control: 0.30 +/− 0.02; ShRNA-ZNF335: .66 +/− 0.04, mean+/−SD, ANOVA, P<0.0001; n=12 electroporated brains that were analyzed used serial sections).
(H) Knockdown of Znf335 leads to more targeted cells in the lower layers of the mouse cortex and fewer targeted cells in upper layers of the mouse cortex, indicating more premature neurogenesis upon knockdown of Znf335. Earlier born neurons reside in deeper layers vs. later born neurons that reside in the upper layers. Scale: 50μm.
(I) Cortex was divided into equal-sized bins and counted for proportion of targeted cells present in that bin. UT-Control: Bin1: 10.6 +/− 4.9; Bin2: 25.8 +/?− 3.7; Bin3: 34.6 +/− 5.2; Bin 4: 29.1 +/− 4.8; shRNA-ZNF335: Bin1: 8.1 +/− 7.1; Bin2: 16.5 +/− 6.1; Bin3: 20.7 +/− 3.6; Bin4: 54.7 +/− 5.1. mean+/−SD, T-test; Bin3:P=0.0003, Bin4:P=0.0001; n=12 electroporated brains. Only matching sections between conditions were compared.
See also Fig S3.

