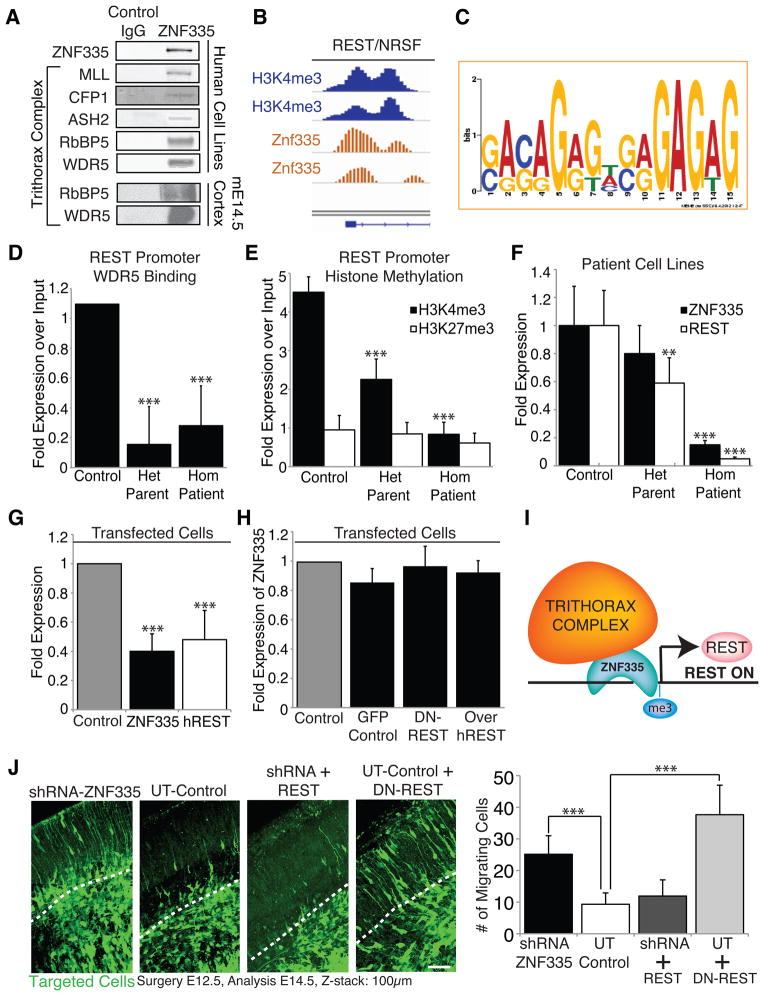
Figure 6. Znf335 interacts with trithorax complex proteins and is upstream of many neuronal differentiation genes including REST/NRSF.
(A) Blots show co-immunoprecipitation of Znf335 with members of the trithorax complex in human cell lines and mouse E14.5 cortex indicating an interaction of Znf335 with the histone mehtyltransferase complex.
(B) Znf335 binds to promoter region of REST/NRSF, and overlaps peaks of H3K4me3 binding.
(C) Promoter Binding consensus motif for Znf335 with GAGAG motif that is predicted for C2H2 zinc fingers (Omichinski et al., 1997).
(D) Decreased binding of trithorax complex proteins such as WDR5 to the REST promoter under low levels of Znf335. WDR5: Control: 1.09 +/− 0, Het Parent: 0.16 +/− 0.25, Hom Patient: 0.28 +/− 0.27; chromatin was obtained and compiled from 3 different growth cultures. Two IPs were performed for each pooled set of chromatin isolated from lymphoblast cell lines, and qPCR was run in triplicates in comparison to input. All qPCR runs were normalized to GAPDH.
(E) Decreased H3K4 trimethylation (marker of gene activation) of the REST promoter under low levels of Znf335, but no changes in H3K27 trimethylation. H3K4me3: Control: 4.5 +/− 0.39, Het Parent: 2.25 +/− 0.53, Hom Patient: 0.84 +/− 0.3; H3K27me3: Control: 0.95 +/− 0.37; Het Parent: 0.85 +/− 0.29; Hom Patient: 0.6, +/− 0.25; chromatin was obtained and compiled from 3 different growth cultures. Two IPs were performed for each pooled set of chromatin isolated from lymphoblast cell lines, and qPCR was run in triplicates in comparison to input. All qPCR runs were normalized to GAPDH.
(F) qPCR measurement show lower levels of properly spliced ZNF335 expression and hREST expression in het parents and hom patients as compared to controls. ZNF335 analysis was done with primers specific to only the properly spliced mRNA. Incomplete splice forms would not have been picked up with primer pairs (Exon19F, Exon 20R, Exon21R): Control: 1 +/− 0.28, Het Parent: 0.80 +/− 0.21, Hom Patient: 0.15 +/− 0.03; hREST: Control: 1 +/− 0.25; Het Parent: 0.59 +/− 0.18; Hom Patient: 0.05, +/− 0.01; Mean+/−SD, T-test compared to control, homozygous patients p<0.001; n=9 qPCR readouts from 3 different growth cultures. RNA was extracted from lymphoblast cell lines. All qPCR runs were normalized to NMYC and GAPDH.
(G) Decreased levels of hREST expression is seen upon direct knockdown of ZNF335. Control: 1, ZNF335: 0.41 +/− 0.12, P=0.0001; hREST: 0.48 +/− 0.20, P=0.0001; Mean+/−SD, T-test; n=6 individual transfections of HeLa cell lines. All qPCR runs were normalized to GAPDH.
(H) Converserly, ZNF335 expression is not significantly changed upon expression of Dominant-Negative REST, or overexpression of hREST. 6H: GFP Control: 0.85 +/− 0.09; DN-REST: 0.97 +/− 0.14; Over-hREST: 0.92 +/− 0.08; Mean+/−SD, T-test, non-significant; n=3 sets of transfections of HeLa cell lines. Similar results also seen with Hek293 cells lines (data not published). All qPCR runs were normalized to GAPDH.
(I) Schematic of Znf335 interacting with the trithorax complex to trimethylate H3K4 at the promoter of REST to turn on REST expression.
(J) Knockdown of Znf335 leads to premature cell cycle exit and neuronal migration in cortical plate. Addition of REST rescues the phenotype and recapitulates control while addition of dominant-negative REST mimics Znf335 knockdown phenotype. Dashed line represents bottom of cortical plate. Scale: 50μm. UT-Control: 9.32 +/− 3.57; shRNA- ZNF335: 25.6 +/− 8.34; shRNA+REST rescue 11.92 +/− 5.1; UT+DN-REST rescue: 37.6 +/− 0.3. UT-shRNA P=0.0001, UT-DNREST rescue P=0.0001; Mean+/−SD, T-test; n=3 different electroporation litters, and analysis from each litter was pooled. See also Fig S5 and Tables S1–S7

