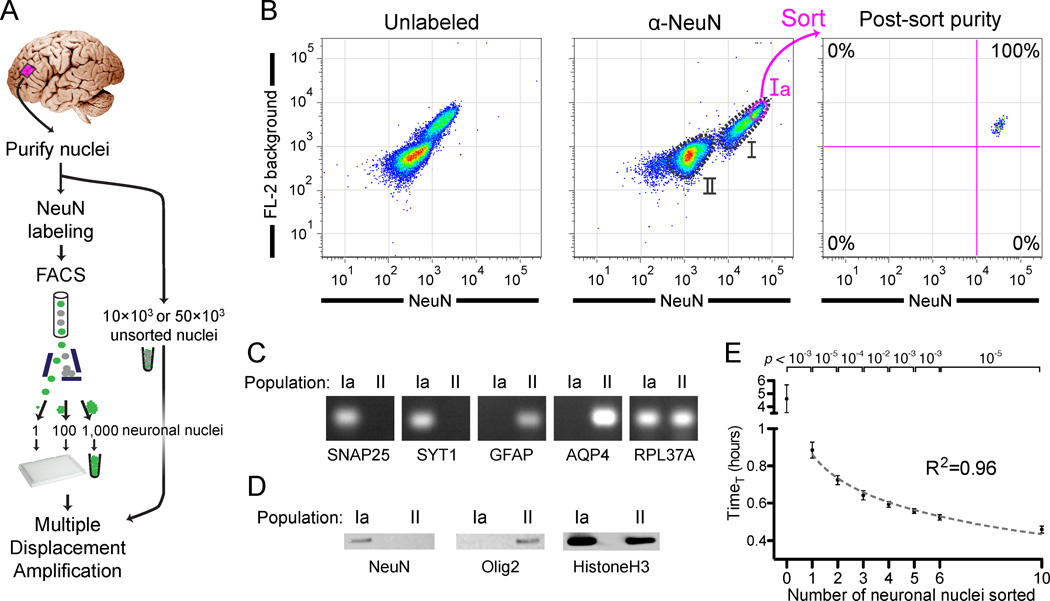
Figure 1. Isolation and genome amplification of single human neuronal nuclei.
(A) Schematic of the method.
(B) Fluorescence-activated cell sorting of cortical nuclei stained with NeuN shows two separable populations: NeuN+ (population I) and NeuN− (population II). A subset of population I (Ia) consisting of large neuronal nuclei was sorted and reanalyzed, confirming sort purity. Two populations of nuclei are sometimes apparent without NeuN staining, due to the increased background staining of the larger population I nuclei. Fluorescence decrease of the sorted population on reanalysis is always observed due to photobleaching and washing of non-specific staining in the first sort.
(C) RT-PCR confirming the neuronal and non-neuronal identities of populations Ia and II, respectively, by assaying for expression of nuclear RNA for two neuronal (SNAP25 and SYT1), two astroglial (GFAP and AQP4), and input control (RPL37A) genes. RT-PCR and western blot experiments (Figures 1C and 1D) were performed with NeuN/Mef2c double labeling in which all NeuN+ nuclei were Mef2c+ (data not shown).
(D) Western blot analysis of NeuN and Olig2 (an oligodendrocyte marker), confirming neuronal and non-neuronal identity, respectively, of populations Ia and II.
(E) Quantitative MDA reactions monitored in real-time confirm accurate sorting of the desired number of nuclei. The time to amplify to a threshold above background (TimeT, analogous to qPCR CT value) is plotted on the y-axis (error bars ±1SD, n=7 or 8 reactions per condition). Points were fit to a semi-log line of slope −4.3, corresponding to 1.7-fold amplification per unit time.
See also Figure S1.

