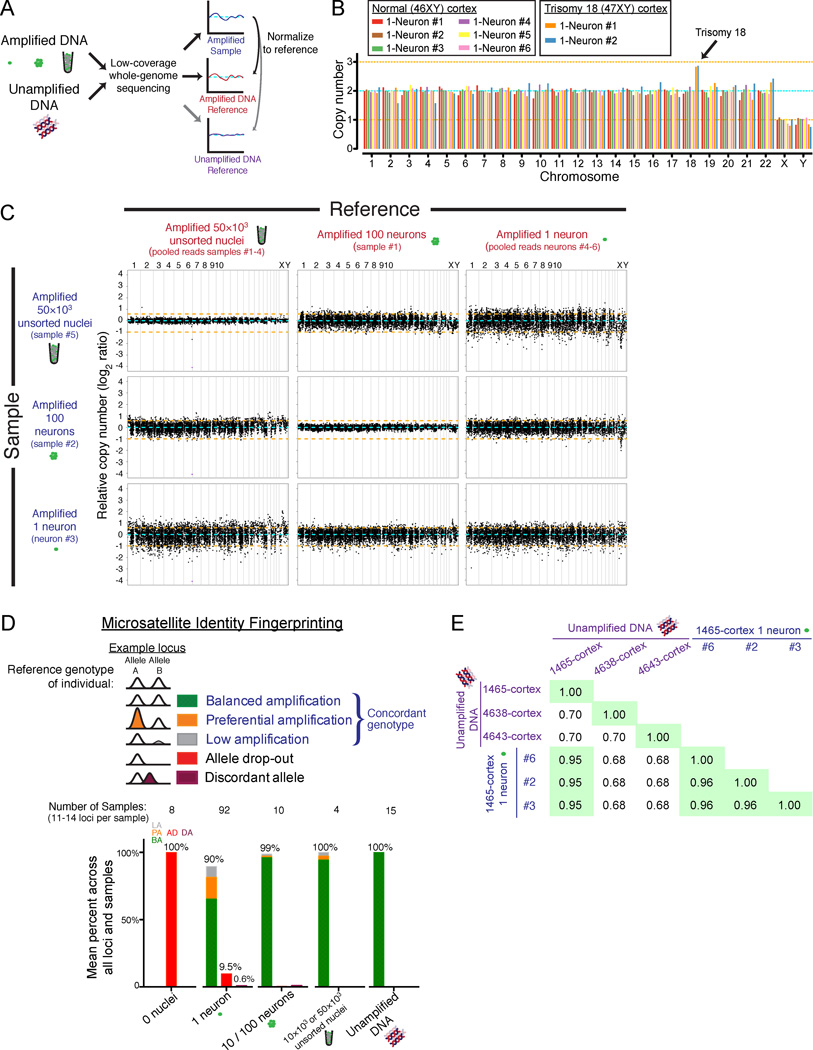
Figure 2. Single-neuron genome-wide coverage, amplification bias, and identity fingerprinting.
(A) Schematic of the low-coverage genome sequencing method.
(B) Chromosome copy numbers of single cortical neurons from normal (UMB1465, 46XY) and trisomy 18 (UMB866, 47XY,+18) individuals. Copy numbers are normalized to the median copy number of each chromosome across the 8 single neurons, with autosomes adjusted to a median copy number of 2. Orange lines denote ±1 copy.
(C) Higher-resolution copy number profiling in 6,000 equal-read bins of ~500kb in size shows that MDA bias can be corrected by normalization to an MDA-amplified reference. Orange lines denote ±1 copy, and purple points indicate off-scale bins.
(D) Identifiler fingerprinting confirms the single neurons derive from the correct individuals, and measures allele preferential amplification (PA), low amplification (LA), allele dropout (AD), and discordant allele (DA) rates.
(E) Fraction of genotypes by SNP microarray that are concordant between 3 single neurons and bulk DNA confirms the single neurons derive from the correct individual.

