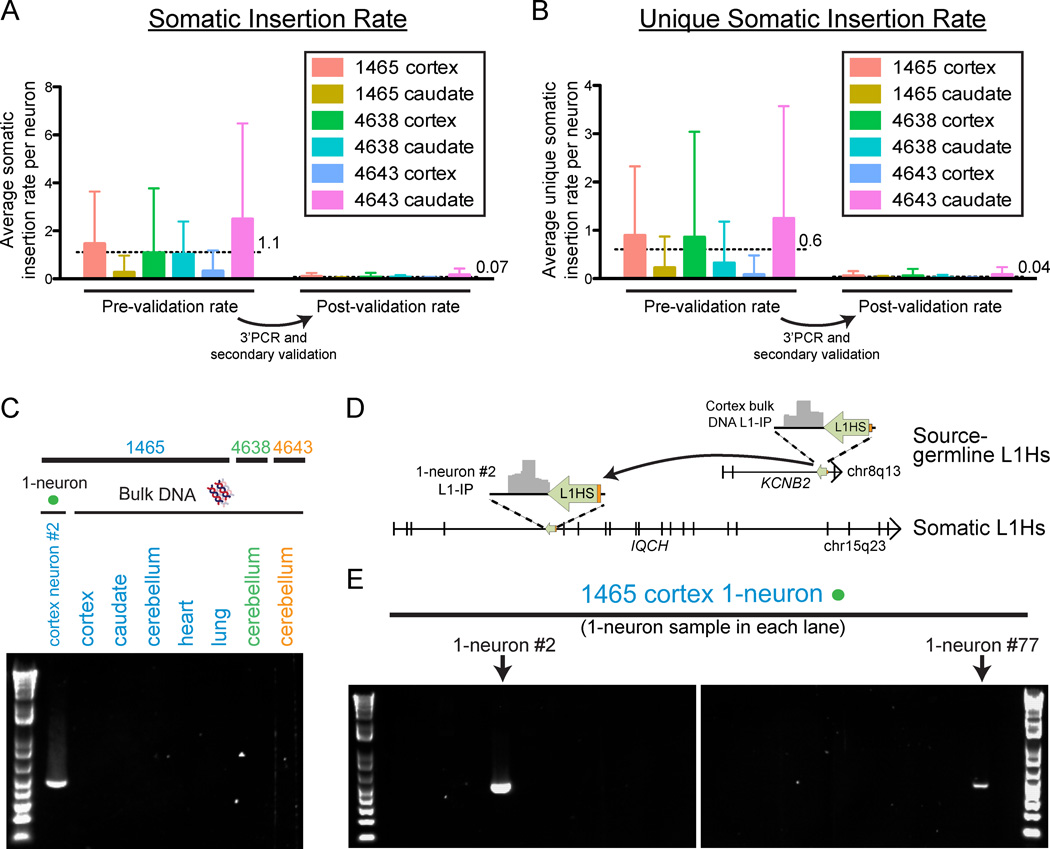
Figure 6. Quantification of somatic L1Hs insertions, and validation of a somatic insertion, in single neurons.
(A) Mean number (±SD) of somatic insertion candidates per single neuron in each tissue in the study, corrected for sensitivity. The insertion rates per neuron are shown before and after 3’PCR and secondary validation. Horizontal dashed lines and adjacent numbers indicate the mean number of insertions across all single neurons from all tissues. Low-quality samples that did not achieve the necessary KNR detection rate with a confidence score >0.5 were excluded from the analysis in a quality control check (‘QC-fail’ in Table S2). The number of cells included in each analysis were n=50, 45, 45, 50, 50, and 44 for 1465-cortex, 1465-caudate, 4638-cortex, 4638-caudate, 4643-cortex, and 4643-caudate, respectively, after removing low-quality samples failing quality control.
(B) Mean number (±SD) of unique somatic insertion candidates (i.e. present in only one single neuron sample of the individual) per single neuron in each tissue, corrected for sensitivity.
(C) Gel images of 3’PCR validation of a somatic L1Hs insertion found by L1-IP in individual 1465 cortex 1-neuron #2 (L1-IP peak ID chr15_67625710_plus_0_0).
(D) Location of the somatic L1Hs insertion (L1-IP peak ID chr15_67625710_plus_0_0) in antisense orientation in intron 4 of the gene IQCH, and the corresponding L1-IP peak in 1465-cortex 1-neuron #2. The insertion’s target site duplication coordinates are chr15: 67,625,702–67,625,714 (hg19). A 5’ transduction (orange) identified the source L1Hs on chr8: 73,787,792–73,793,823.
(E) Representative gel images from a 3’PCR screen of 83 1-neuron samples from individual 1465 cortex (24 1-neuron samples shown) for the somatic insertion in Figures 6C and 6D. The two cortical 1-neuron samples (#2 and #77) found to have the insertion are shown. 1-neuron #77 was found to have the insertion only in the 3’PCR screen since it was not profiled by L1-IP. 3’PCR product sequencing and full-length cloning confirmed the insertion had identical 5’ and 3’ breakpoints and TSD in both neurons (#2 and #77).
See also Figure S7.

